Figure 1.
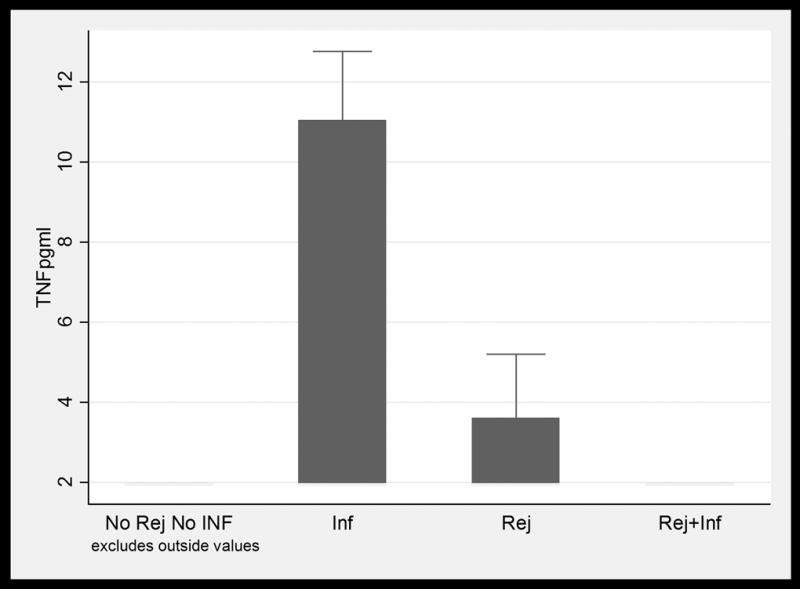
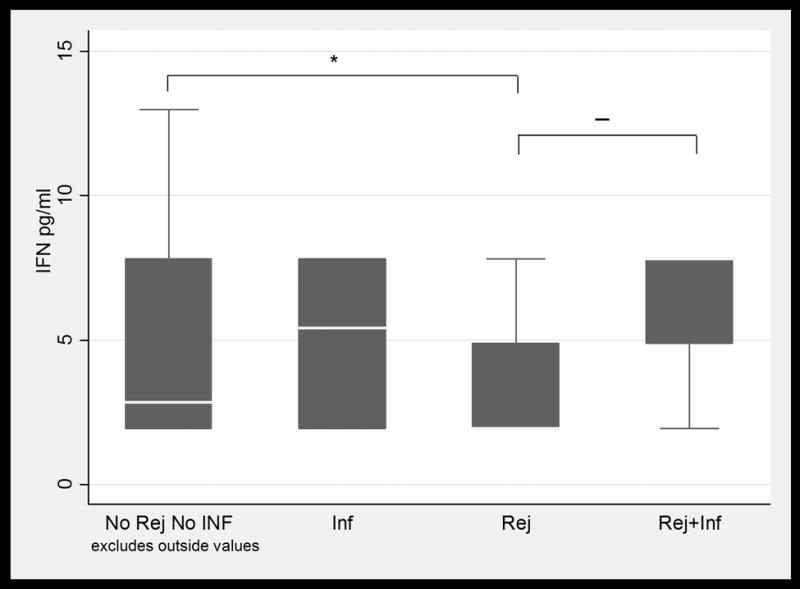
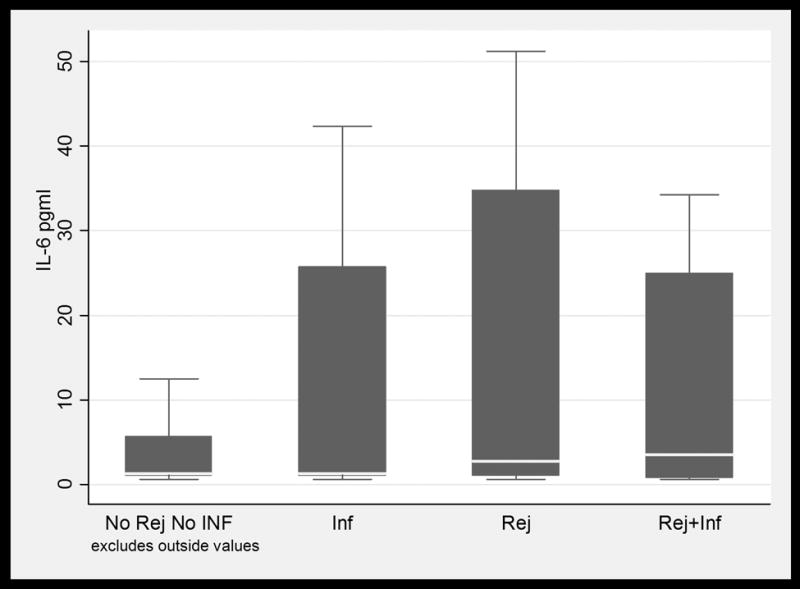

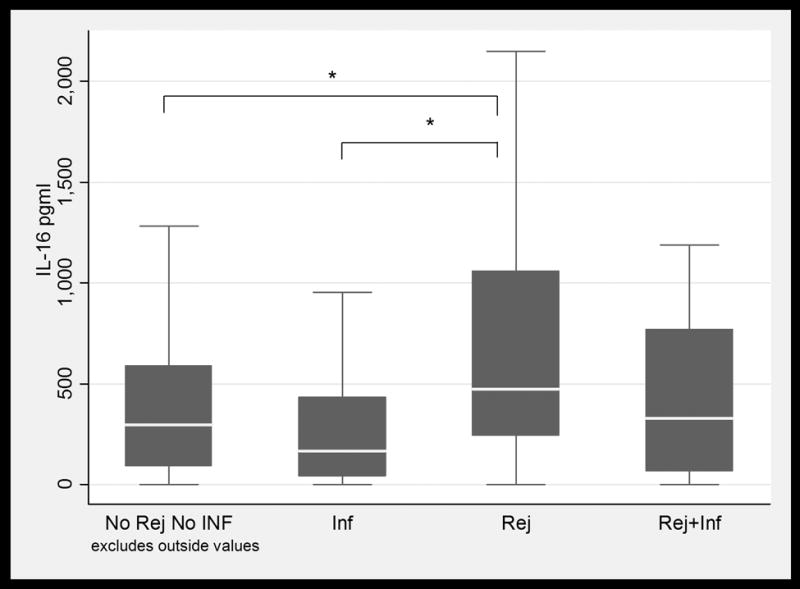
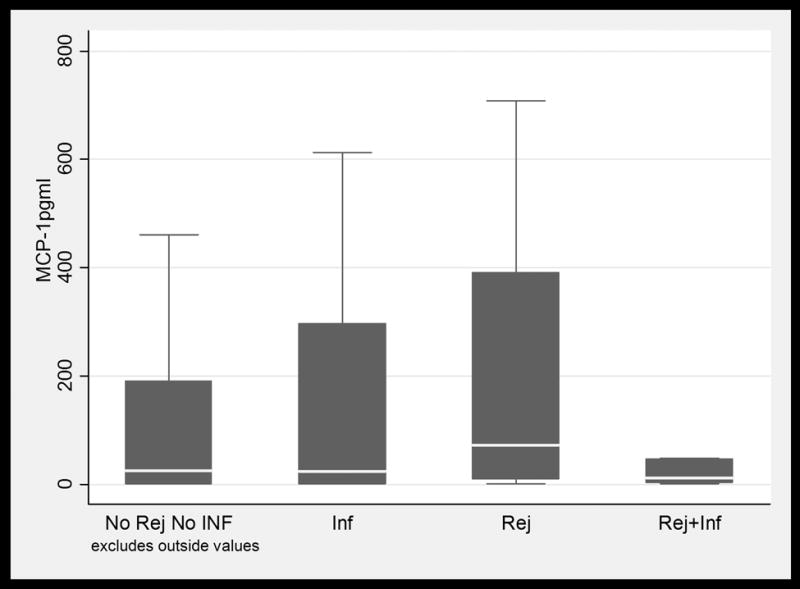
BAL fluid concentrations values in LTRs with and without infection and /or ACR. Only IL-16 values were significantly higher in patients with ACR when compared to patients with infection. (1a) TNFα; (1b) IFNγ; (1c) IL-6; (1d) IL-15; (1e) IL-16; and (1f) MCP-1. Horizontal line represents the median, the box encompasses the 25-75 percentile and the error bars encompass the 10th -90th percentile. * Represents Pairwise Wilcoxon Rank Sum Tests (p ≤ 0.01):
