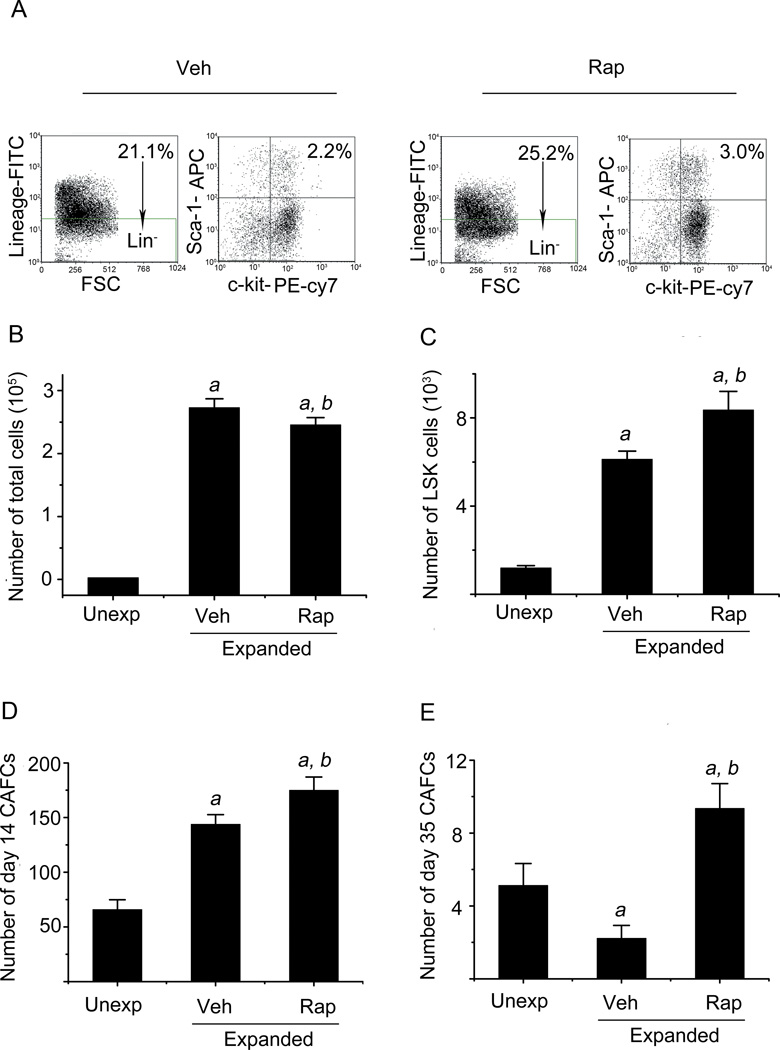
Figure 2. Inhibition of mTOR with rapamycin promotes ex vivo expansion of HSCs.
Lin−Sca1+ cells were cultured in vitro for 5 days without any treatment and then cultured with either vehicle (Veh, 0.1% DMSO) or rapamycin (Rap, 20 ng/ml) from day 6 to day 9. The cells harvested from the cultures on day 10 were enumerated and analyzed by flow cytometry and CAFC assay. (A) Representative flow cytometric analyses of LSK cells in the cultures with Veh or Rap. The numbers presented in the flow charts are frequencies for each cell population indicated. (B) Number of total nucleated cells. (C) Number of LSK cells. (D) Number of day-14 CAFCs. (E) Number of day-35 CAFCs. The data in B-E are presented as mean ± SE (n=3 independent cultures) recovered from the cultures with 3000 input (Unexp) Lin−Sca1+ cells. a, p<0.05 vs. unexpanded cells; and b, p<0.05 vs. cells expanded with vehicle.

