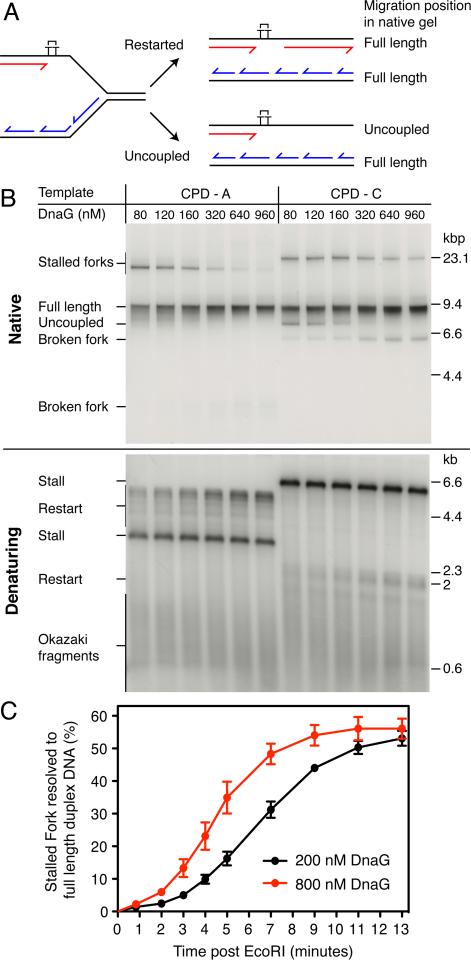
Figure 4. Primase Concentration Influences the Rate of Leading-strand Reinitiation.
(A) Illustration of the replication products generated following restarted replication, or complete uncoupled replication downstream from the CPD.
(B) Titration of DnaG using standard reaction conditions for 6 min.
(C) Quantification of full-length replication products (restarted leading strands and lagging strands) from pulse-chase experiments conducted using 200 nM and 800 nM DnaG on the CPD-A+C template. Note that complete uncoupled replication is not observed at either concentration of DnaG (Figure S6). Error bars represent the SEM from three independent experiments.

