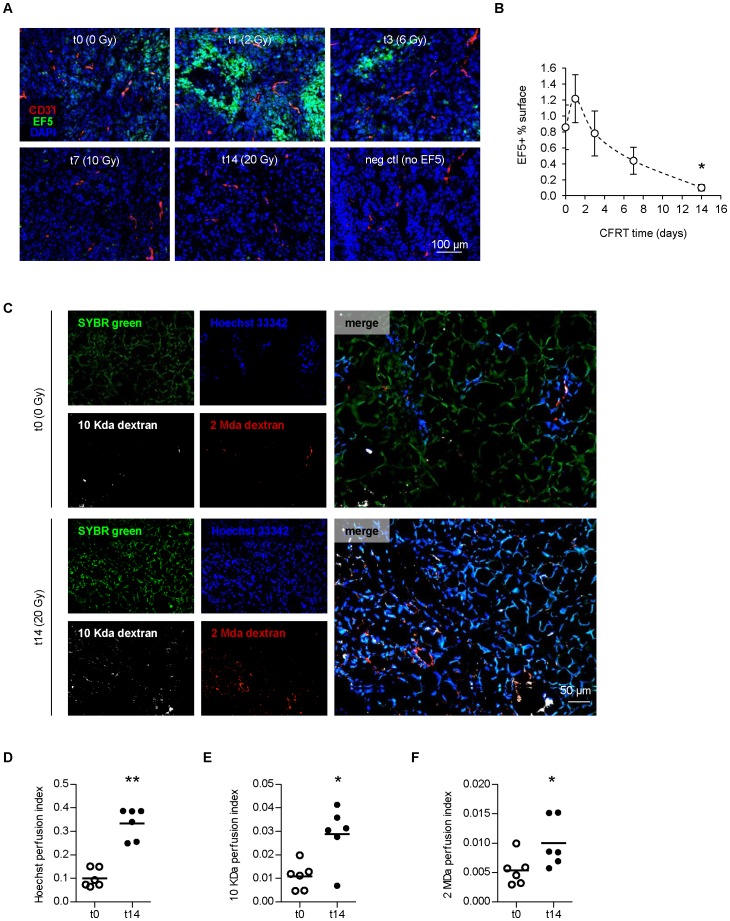
Figure 2. Fractionated irradiation reduces hypoxia and increases tumor perfusion.
(A) Pseudo-confocal images of tumors during CFRT, stained for hypoxia (EF5) and endothelial cells (CD31). (B) Image quantification of EF5+ surface in tumors during CFRT. Values represent the average of n≥13 per point ± sem. (C) Pseudo-confocal images of tumors perfused with Hoechst 33342 and 10 kDa/2 MDa dextrans before (t0) or after 2 weeks of CFRT (t14). SYBR green was used as a counterstain of total cell nuclei. (D,E,F) Image quantification of Hoechst+ (D), and medium (E) and large (F) dextran+ surfaces in tumors during CFRT (n = 6). (B,D,E,F). Statistical comparisons vs. t0.

