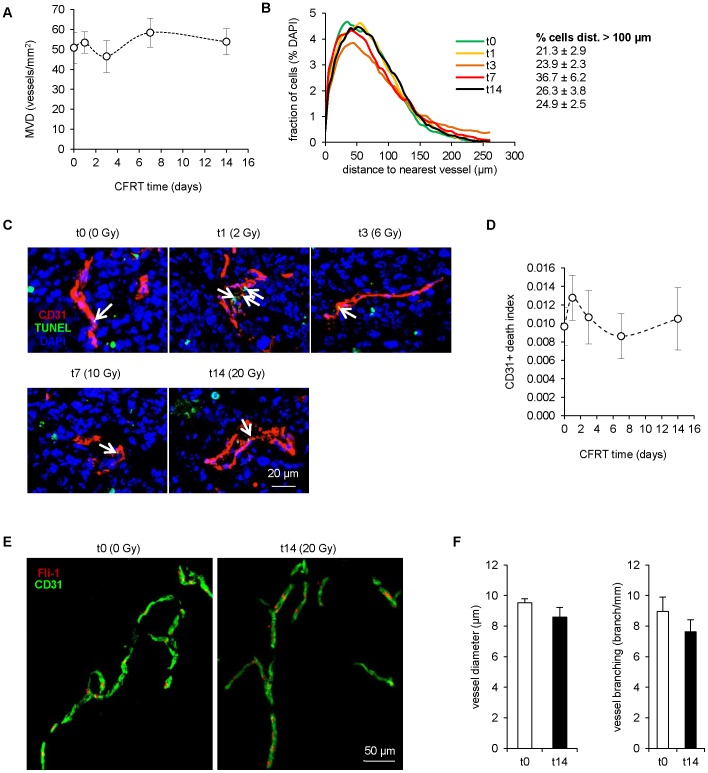
Figure 3. Maintenance of vascular density and distribution during fractionated irradiation.
(A) Microvessel density in tumors during CFRT. Values represent the average of n≥13 per point ± sem. (B) Distance profile between cells and the closest blood vessel, from tumors during CFRT. Profiles are based on n≥13. Statistical comparisons vs. t0. (C) Pseudo-confocal images of tumor-associated blood vessels (CD31+) stained for TUNEL during CFRT. Arrows: TUNEL+/CD31+ cells. (D) Image quantification of CD31+/TUNEL+ surface. Values represent the average of n≥13 per point ± sem. (E) Representative Z-stack images of 100 µm-thick tumor sections before (t0) or after 2 weeks of CFRT (t14) and stained for blood vessels (CD31+/Fli-1+). (F) Image analysis of blood vessel network from 100 µm-thick tumor sections. Values represent the average of n = 9 per point ± sem.

