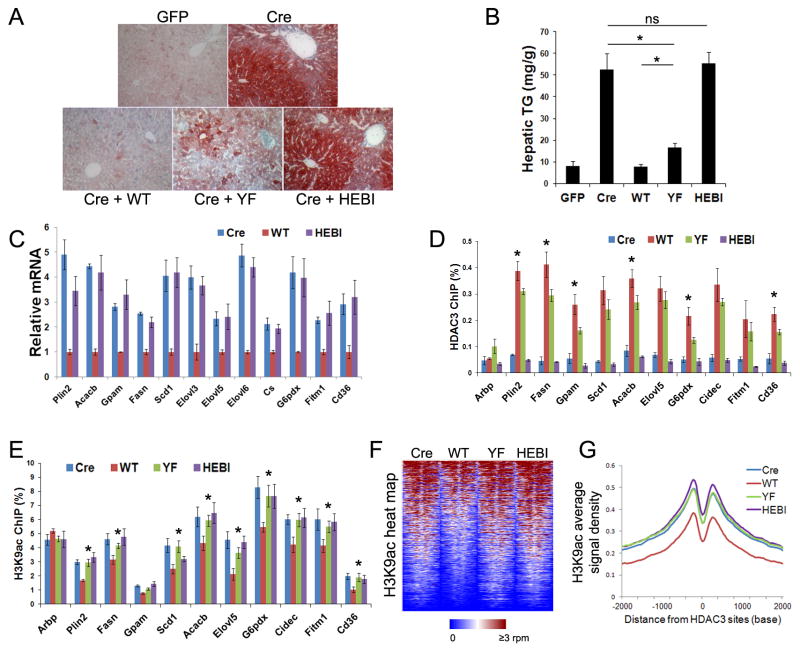
Figure 6. Loss of interaction with NCOR renders hepatic HDAC3 completely nonfunctional in vivo.
(A) ORO stain of livers from HDAC3f/f mice injected with the indicated AAV vectors. (B) Hepatic triglyceride (TG) measurement, n = 4. (C) RT-qPCR analysis of livers from mice described above, n = 4. (D) The livers were subjected to ChIP with HDAC3 antibodies followed by qPCR analysis using primers specific for HDAC3 sites near the indicated genes, n = 4. * P < 0.05 between WT and YF. (E) ChIP-qPCR analysis of the livers with H3K9ac antibodies, n = 4. * P < 0.05 between WT and any of the other three groups. (F) Heat map of H3K9ac ChIP-seq signals from −1 kb to +1 kb surrounding the center of HDAC3 sites within 50 kb of genes that are upregulated upon HDAC3 depletion. (G) Average H3K9ac signals, represented by reads per bp in 10 million total reads, from −2 kb to +2 kb surrounding the center of HDAC3 sites. All error bars, s.e.m.

