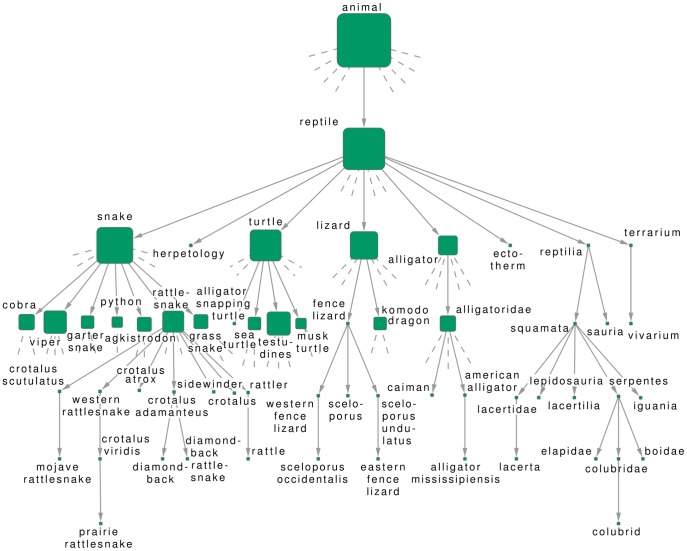
Figure 3. Subgraph from the hierarchy between Flickr tags.
By running our algorithm B on a filtered sample from Flickr, we obtained a hierarchy between the tags appearing on the photos in the sample. Since the total number of tags in our data reached 25,441, here we show only a smaller subgraph from the result, corresponding to a part of the tags categorized under “reptile”. Stubs correspond to further direct descendants not shown in the figure, and the size of the nodes indicate the total number of descendants on a logarithmic scale, (e.g., “prairie rattlesnake” has none, while “snake” has altogether 110.).

