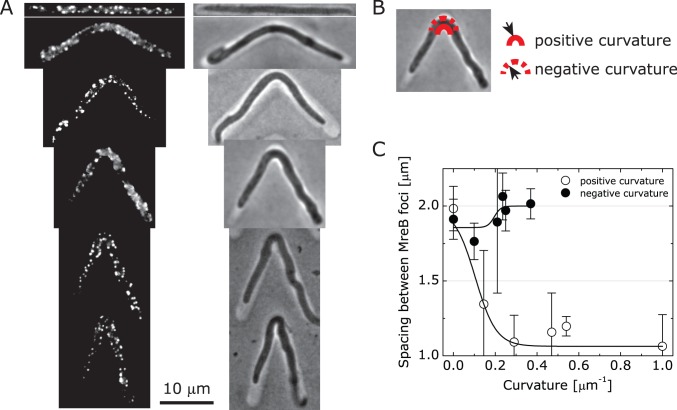
Figure 2. Analysis of MreB distribution in artificially curved bacterial cells.
(A) Composite, representative fluorescence and bright field images of filamented E. coli FB76 cells in V-shaped channels depicting the spatial distribution of MreB-RFP. Scale bar: 20 µm. (B) An image depicting the positive and negative mean cytoplasmic membrane curvature imposed on the cell. (C) A plot depicting the spacing between MreB foci as a function of mean cell wall curvature determined for cells isolated in V-shaped microchannels and imaged using fluorescence microscopy. The plot depicts the spacing between MreB foci along the positively and negatively curved cytoplasmic membranes in confined cells. The lines between the data points are provided as a guide. For each value of channel curvature, we measured n≥30 cells; error bars represent standard error of the mean.

