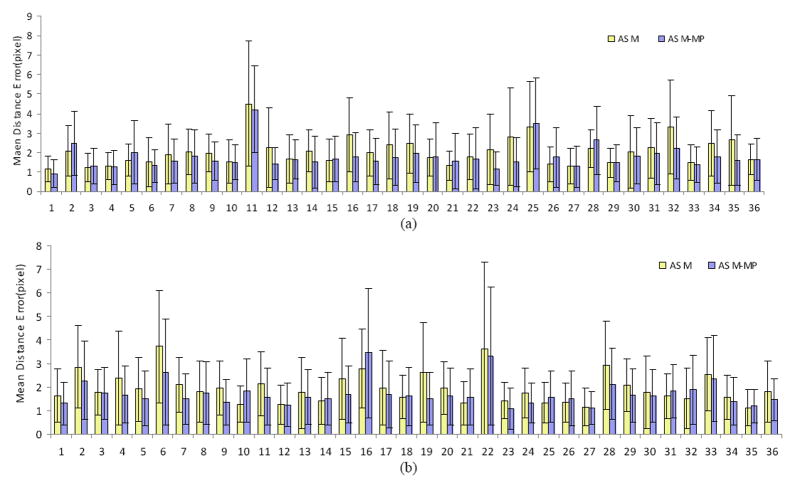
Figure 3.
Comparison of the mean distance errors and the standard deviation by ASM and ASM-MP for 72 images (e.g., group A, 36 images in (a) and group B, 36 images in (b)). The ASM-MP method has small distance errors for most images compared to the ASM method. A p value of less than 0.001 demonstrates that the two groups are significantly different.

