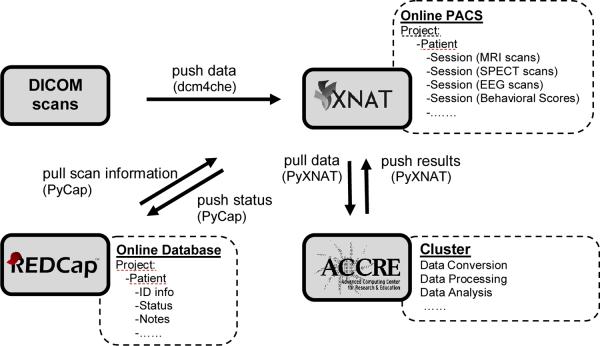
Figure 1.
Overview of the integrated system. Multi-modal DICOM scans (upper left) are pushed to the XNAT/PACS server (upper right) via dcm4che tools. Verified DICOM scans are pulled and distributed to the cluster (bottom right) for further conversion, processing, and analysis by PyXNAT package scripts. The output results are pushed back for storage on XNAT. The online database REDCap (bottom left) provides/stores related information to/from XNAT. Black arrows indicate the directions of the data flow.

