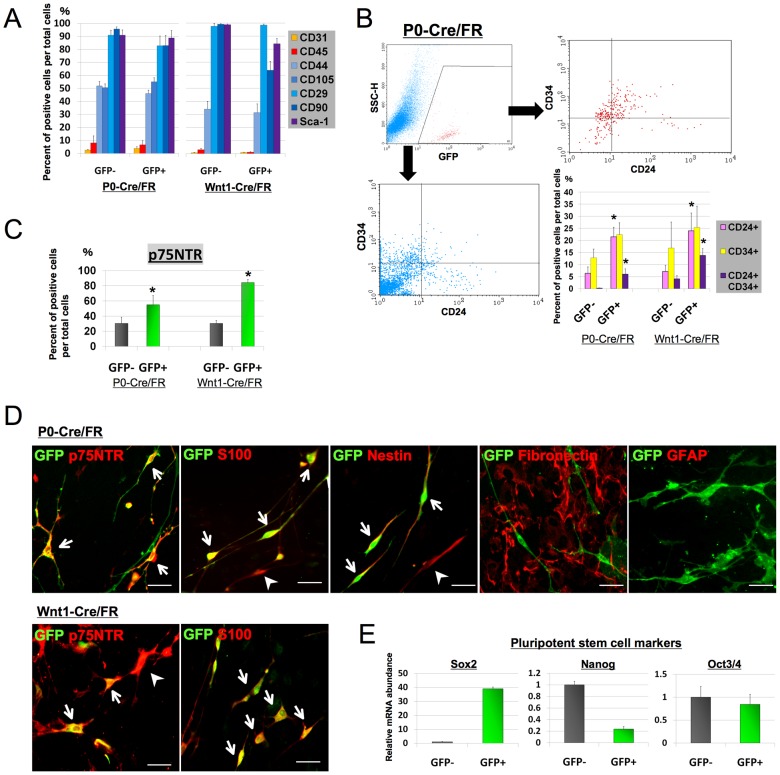
Figure 2. Characterization of neural crest-derived ASCs.
A. Quantification of surface marker expression in both GFP+ and GFP− ASCs of either P0-Cre/FR or Wnt1-Cre/FR mice with flow cytometric analysis. The majority of both GFP+ and GFP− cells expressed MSC markers including CD29, CD44, CD90, CD105, and Sca-1. B. The proportion of both CD24- and CD34-positive cells in the GFP+ population was also higher, and the proportion of double-positive cells in the GFP+ population was more than five-fold higher compared to those in GFP− cells. Representative flow cytometry profiles of CD24/CD34 double-positive cells from P0-Cre/FR mice are shown. C. The GFP+ population had a significantly higher proportion of p75NTR-positive cells. Data (A–C) are shown as the mean + SEM of 4 independent experiments for each condition. *p<0.05 versus GFP− cells, t test. D. Immunofluorescent staining for p75NTR, S100, Nestin, GFAP, and fibronectin (red) of either P0-Cre/FR ASCs (upper five panels) or Wnt1-Cre/FR (lower two panels) shows that the majority of GFP+ cells (green) co-expressed p75NTR, S100, and Nestin (arrow) but were negative for GFAP and fibronectin. A few GFP-negative but p75NTR- S100-, or Nestin-positive cells were also observed (arrowhead). Note that the majority of GFP− cells were positive for fibronectin. Scale bar = 50 µm. E. RT-qPCR analysis for pluripotent markers Sox2, Nanog, and Oct3/4 on FACS-purified GFP− and GFP+ cells from P0-Cre/FR mice. Results are normalized based on GAPDH expression and shown as relative changes to GFP− cells. Data are shown as the mean + SEM of 3–4 independent experiments for each condition.

