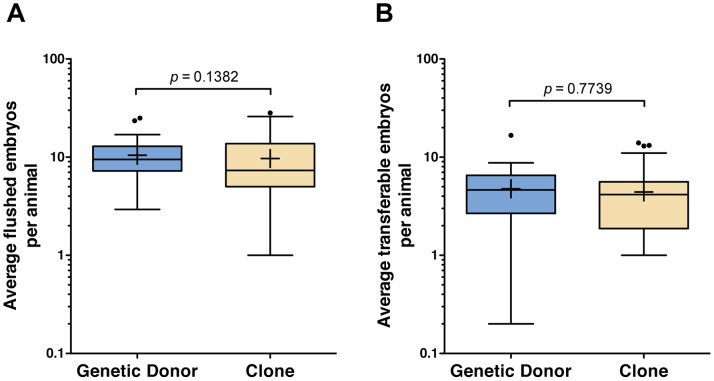
Figure 2. Reproductive performance of clones and their corresponding genetic donors measured by number of flushed embryos and transferable embryos recovered following superovulation, AI and embryo collection.
The average number of flushed embryos (A) or transferable embryos (B) per animal are represented as box-and-whisker plots (whiskers are 1.5× the interquartile range and the plus symbol indicates the mean) for each treatment group. P values of the type III tests for fixed effects (SAS Mixed procedure) are shown.

