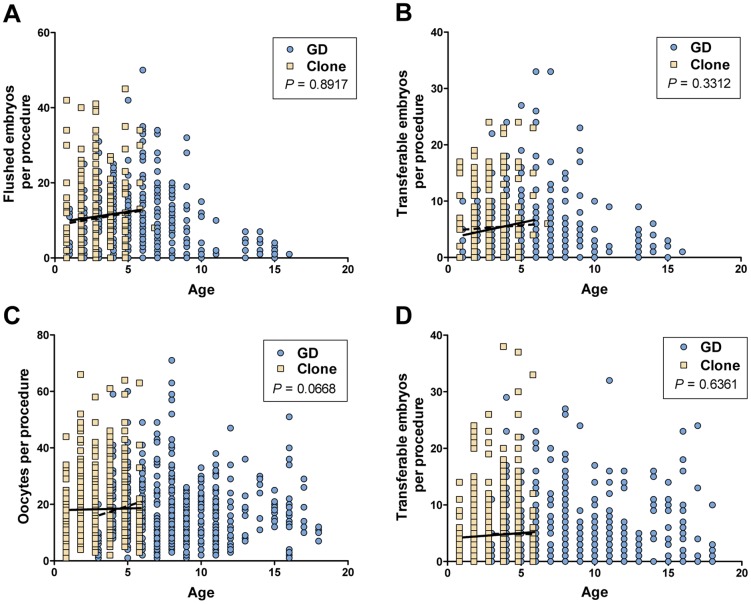
Figure 5. Reproductive performance of clones and corresponding genetic donors (GD) as a function of age.
Data for each individual procedure are shown according to the age of the animal at the time of the procedure as follows: (A) the numbers of flushed embryos or (B) transferable embryos generated by superovulation followed by AI and embryo collection, and (C) the numbers of oocytes or (D) transferable embryos obtained by OPU-IVF. All ages were recorded as years; data for clones are left shifted so that symbols for genetic donors are visible. Lines are the linear regressions for genetic donors (dashed) or clone (solid) groups for animals aged 1 to 6 years. P values for ANCOVA of the slopes of regression lines (GraphPad Prism) are shown.

