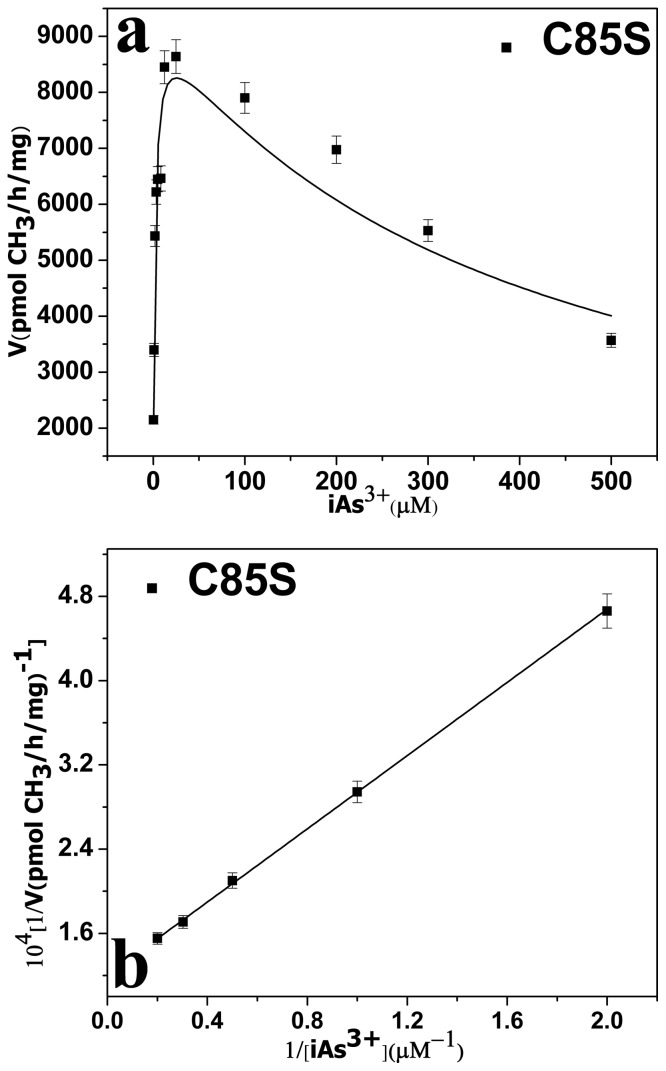
Figure 4.
a Rate of arsenic methylation and Substrate concentration. The line shows the least squares fit of Eq. (1) to the data. b Double reciprocal plot of the arsenic methylation rate against the concentration of iAs3+. Reaction mixtures (100 μl) containing 11 μg enzymes, 1 mM SAM, and 7 mM GSH in PBS (25 mM, pH 7.0) were incubated with different concentrations of iAs3+ at 37°C for 2 h with H2O2 treatment before analysis. Values are the averages ± S.D. of three independent experiments performed using three independently purified proteins.

