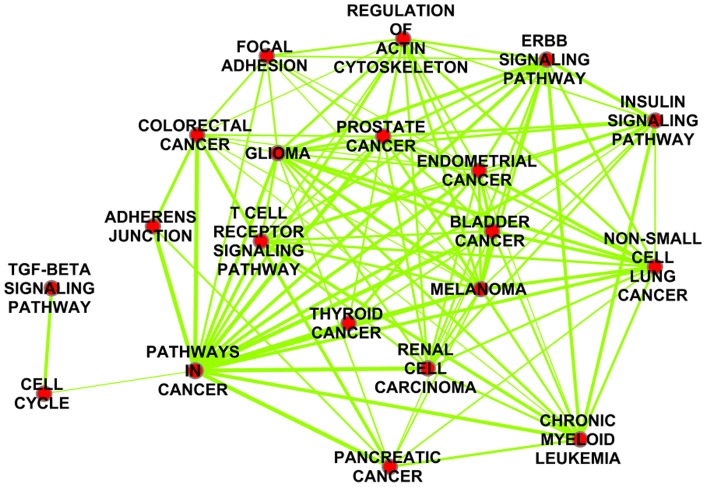
Figure 2. Pathway Enrichment Map of dyregulated protein complexes.
Pathway Enrichment Map of dyregulated protein complexes. We extracted the protein members of the dysregulated protein complexes and found enriched pathways using DAVID online tool.To visualize enrichment map of pathways, we used Enrichment Map Cytoscape plugin [47] to visualize enriched pathways. Nodes in this figure represents enriched pathways, links between nodes represent the fraction of overlap between them. The darker the node the more enriched the pathway is, and the thicker the link, the more significant the overlap is.

