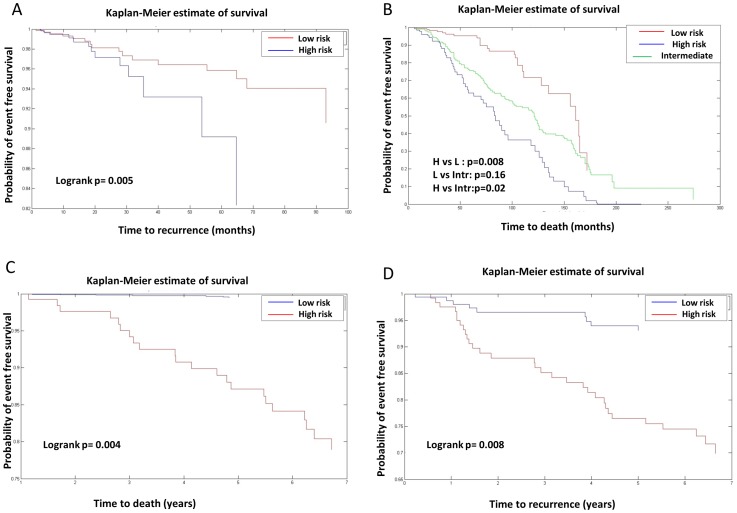
Figure 4. Kaplan-Meier plots for the 23 proteins from the Taylor and Swedish data.
A. Samples were grouped into two groups based on the expression of the 23 proteins from the Taylor mRNA data and then logrank test was applied to assess separation significance (p = 0.005). B. Samples from the Swedish prostate cohort were grouped into three groups using the expression of the 23 proteins. The resulted three groups are significantly separated which shows the prognostic power of the 23 proteins (low risk vs. high risk (p = 0.008), low risk vs. intermediate risk (p = 0.16), high risk vs. intermediate risk ( p = 0.02)). C. Samples from the Swedish breast cohort were grouped into two groups based on the expression of the 23 proteins. The two groups have distinct death specific association (p = 0.004). D.Samples from the Swedish breast cohort were grouped into two groups based on the expression of the 23 proteins. The two groups have distinct cancer recurrence profile (p = 0.008).

