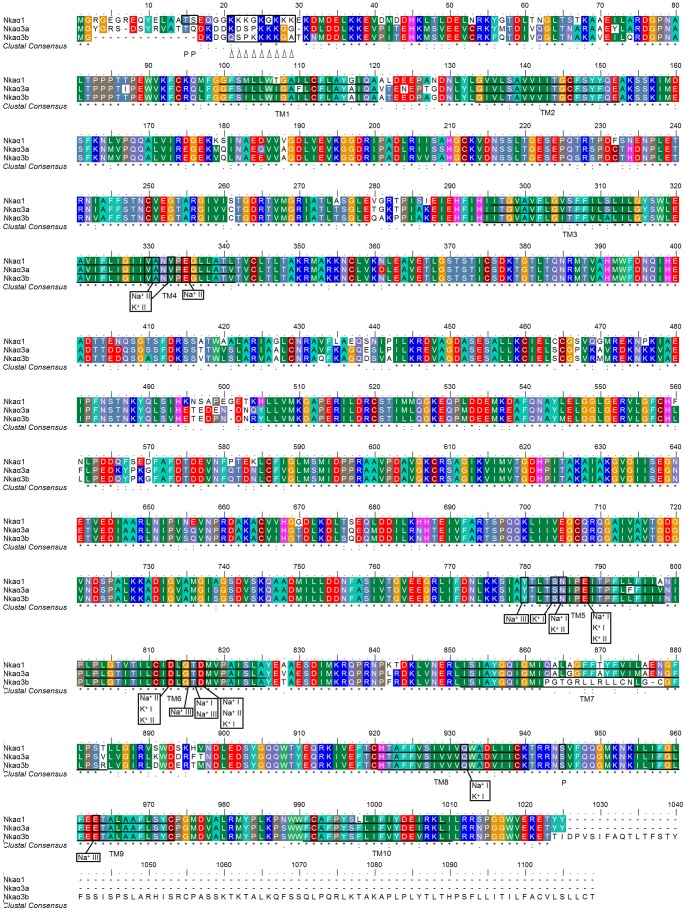
Figure 2. Molecular characterization of Na+/K+-ATPase (Nka) α1, Nkaα3a and Nkaα3b.
A multiple amino acid sequence alignment of Nkaα1, Nkaα3a and Nkaα3b from the brain of Monopterus albus. Identical amino acid residues are indicated by asterisks, strongly similar amino acids are indicated by colons and weakly similar amino acids are indicated by periods. The ten predicted transmembrane regions (TM1–TM10) are underlined. Vertical boxes represent coordinating residues for Na+ or K+ binding. ‘P’ denotes phosphorylation sites and triangles indicate the lysine-rich region. The transmembrane domains of Nkaα1, Nkaα3a and Nkaα3b of M. albus were predicted using MEMSATS and MEMSAT-SVA provided by PSIPRED protein structure prediction server.

