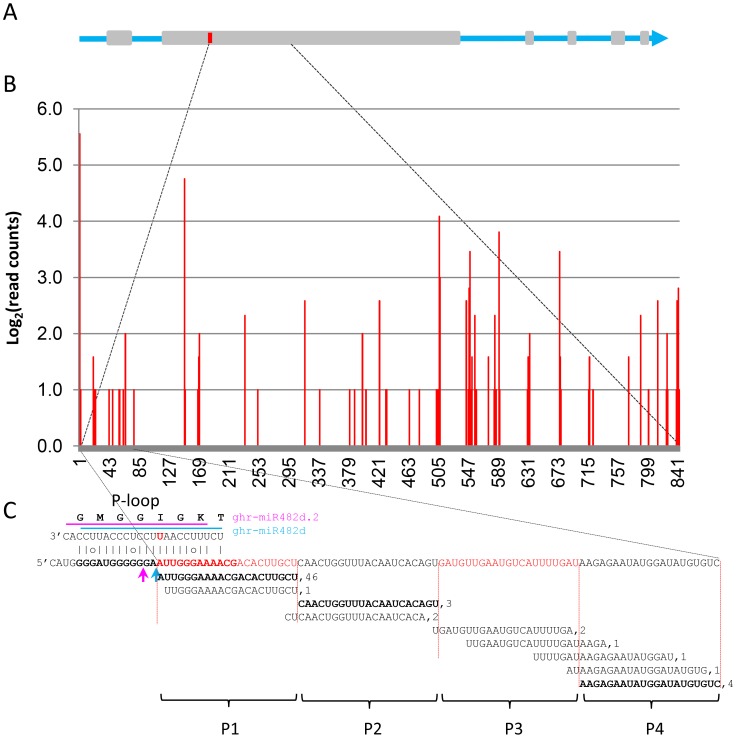
Figure 5. Ghr-miR482d trigged production of phased secondary small RNAs in Gorai.011G075600.
A) Schematic diagram of Gorai.011G075600. Grey boxes represent exons. The red bar represents the location of the P-loop of the NBS domain. B) Distribution pattern of small RNAs generated from the region immediately after the P-loop, which was cleaved by ghr-miR482d. C) Genomic sequence of the P-loop and the first four 21-nt phases (P1–P4). All small RNAs generated from the region corresponding to phases P1 to P4 are shown with the small RNAs in precise phased registers shown in bold. The number after each small RNA represents the counts of the corresponding small RNA in the small RNA datasets used in this study. The sequences underneath the pink and blue lines are ghr-miR482d and ghr-miR2118d, respectively. The expected cleavage sites of ghr-miR482d and ghr-miR2118d are indicated by blue and pink arrow, respectively.

