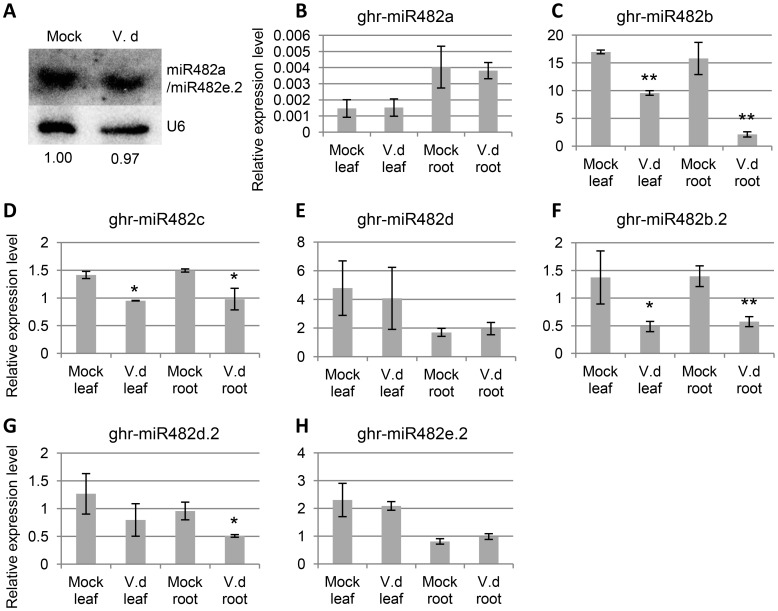
Figure 6. Expression analysis of ghr-miR482/miR482.2.
A) Northern blot detection of ghr-miR482/482.2 in leaves collected from V. dahliae-infected and mock-treated cotton plants at one day-post-inoculation (1 dpi). Oligos antisense to ghr-miR482a and ghr-miR482e.2 were used together as probes. The values underneath the image are the relative signal intensity of ghr-miR482a/482e.2, which were determined using the MultiGauge V2.0 (Fuji Film) and normalized based on U6. V.d: V. dahliae-infected. B to H) Stem-loop qRT-PCR analysis of the expression level of individual members of the ghr-miR482 family. RQ1 DNase treated total RNA isolated from leaves and roots of 1-dpi plants was analysed using ghr-miR482/miR482.2 member specific stem-loop RT and PCR primers. Expression level was normalized to reference gene Histone 3. Error bars represent standard deviation of the expression ratio. * and ** denote significant relative to the corresponding mock-infected control at p<0.05 and p<0.01, respectively.

