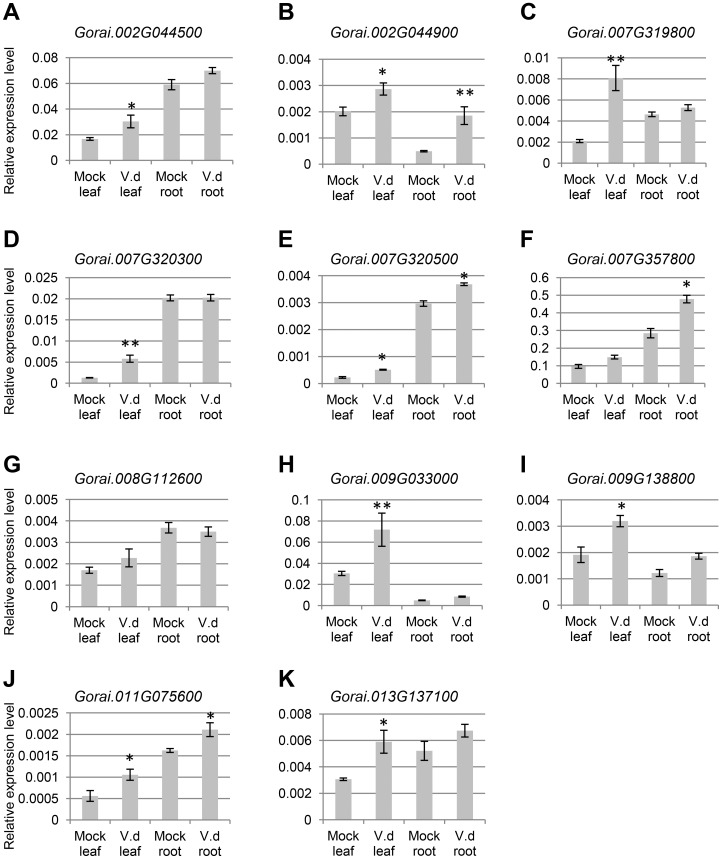
Figure 7. Expression analysis of NBS-LRR genes targeted by ghr-miR482/miR482.2.
The same samples used in miRNA stem-loop qRT-PCR were used in this analysis. Error bars represent standard deviation of the expression ratio. * and ** denote significant relative to the corresponding mock-infected control at p<0.05 and p<0.01, respectively.

