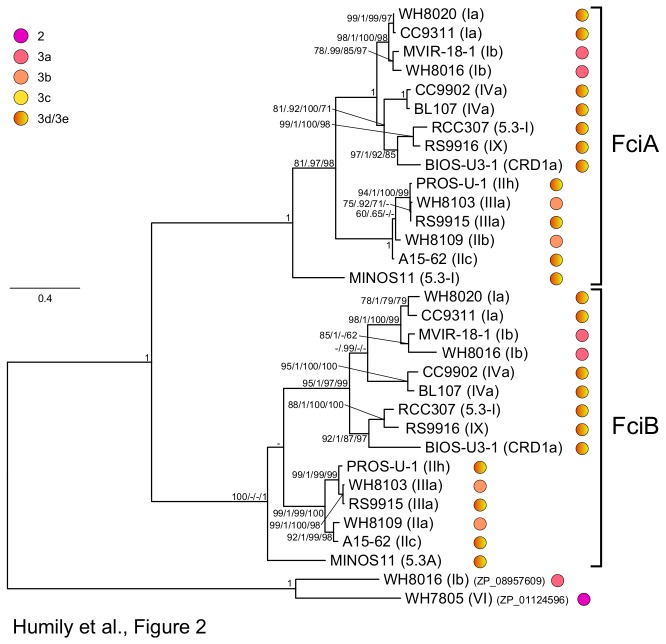
Figure 2. Maximum likelihood analysis of AraC-like proteins (289 aa positions) from marine Synechococcus.
For each strain, the phylogenetic affiliation is mentioned between brackets and the pigment type is indicated by colored circles (see Table 1 for details). Series of four numbers shown at nodes correspond to bootstrap values for ML analyses, Bayesian posterior probabilities (PP, ranging between 0 and 1), and bootstrap values for Neighbor-Joining and Parsimony methods, respectively. Only values higher than 0.60 for PP and 60% for bootstrap values are shown on the phylogenetic tree. The scale bar represents 0.4 substitutions per amino acid.

