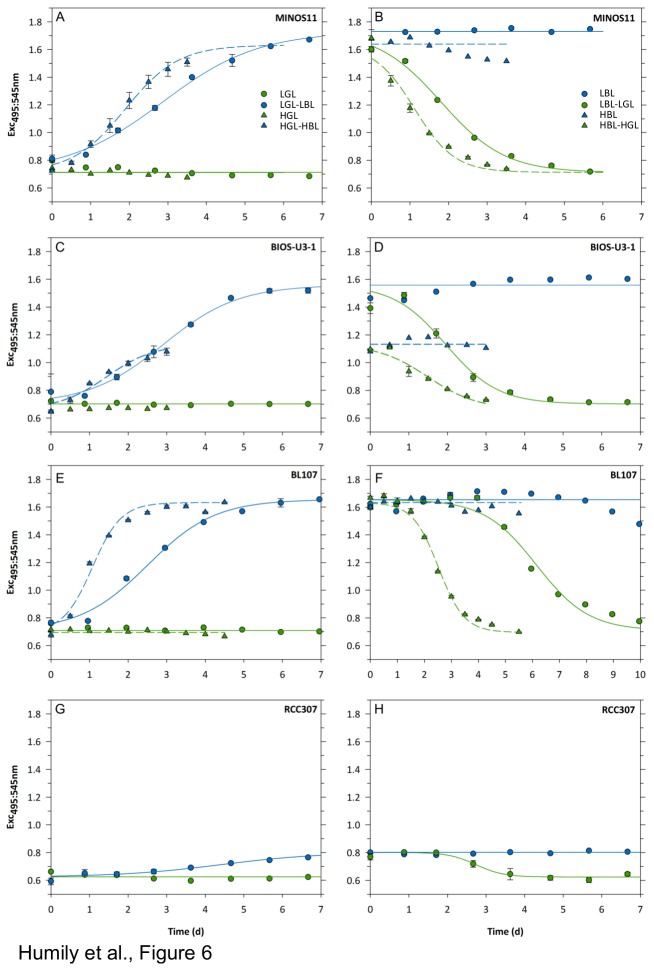
Figure 6. Phenotypic variability of chromatic acclimation in marine Synechococcus.
Temporal changes of the Exc495:545 after shifts from BL to GL (and vice versa) at two irradiances: LL (circles; 20 µmol photons m-2 s-1) and HL (triangles; 75 µmol photons m-2 s-1). The color (blue or green) of lines and symbols matches the ambient light color under which cultures were shifted at time zero. Error bars indicate standard deviation for two biological replicates. Four distinct CA4 phenotypic groups were observed. (A,B) Group 1 strains: MINOS11, A15-62, PROS-U-1, M11.1 and RS9915; (C,D) group 2: BIOS-U3-1, CC9311, WH8020, CC9902 and RS9916; (E,F) group 3: BL107 and CC9902; (G,H): group 4 : RCC307. Note the different x-axis scale for BL107.

