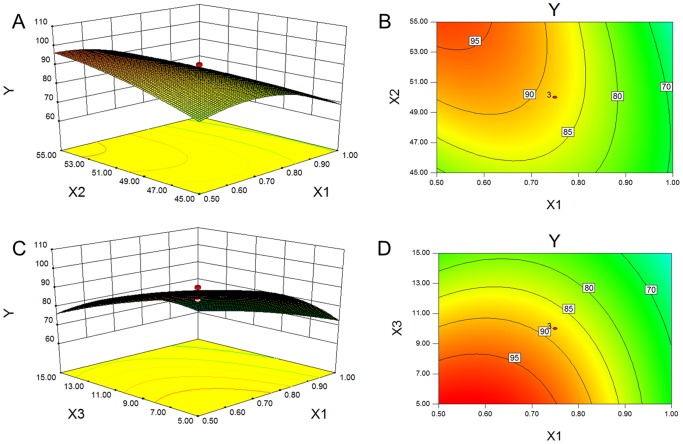
Figure 2. Response surface plots.
The significant (p<0.05) interaction effects for combination percentage, as a function of X1/X2 and X1/X3, are presented as 3D surfaces (A, C) and contours (B, D) respectively. X1: the ratio of scutellarin to phospholipid; X2: the temperature of the water bath; X3: the drug concentration in solvent.

