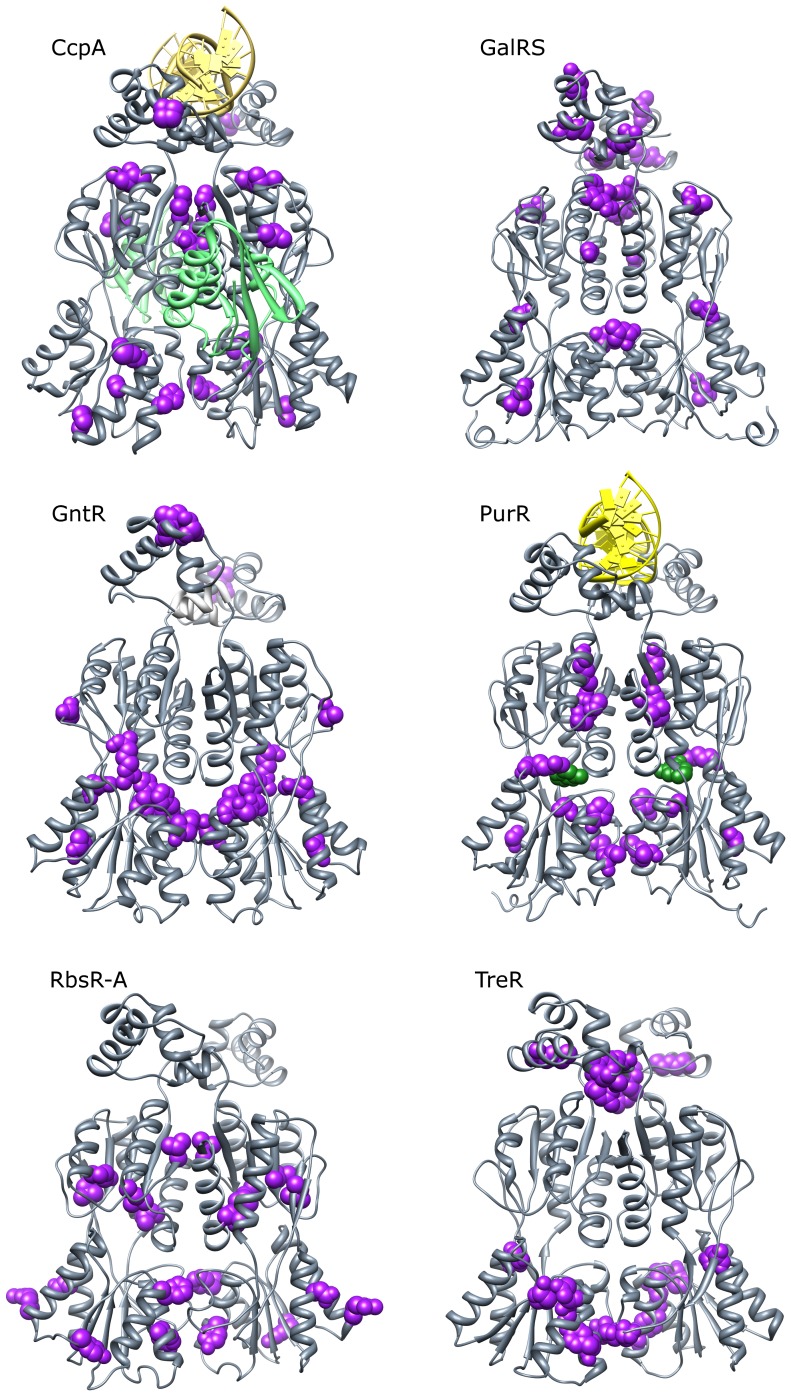
Figure 8. Top co-evolving positions for each subfamily.
Positions (nodes) were scored by the weight of their largest edge in each of the 5 co-evolution networks (ELSC, OMES, McBASC, ZNMI, SCA). These scores were Z-normalized and averaged across the algorithms. Positions were ranked by their average Z-score and the top 10 positions (purple spacefilling) were plotted onto full-length crystal structures (CcpA, PurR) or ITASSER models (GalRS, GntR, RbsR-A, TreR). The DNA operator (yellow) is shown bound to CcpA and PurR; an allosteric effector is shown bound to PurR (green spacefilling); phosphorylated HPr (green ribbon) is shown bound to CcpA. Allosteric effector binding in the cleft between N- and C-regulatory subdomains is common to all six subfamilies, while HPr-Ser46-P interacts only with CcpA. Note that the locations of highly co-evolving sites were not consistent among subfamilies. Molecular graphics were created in UCSF Chimera 1.6.2 [33].

