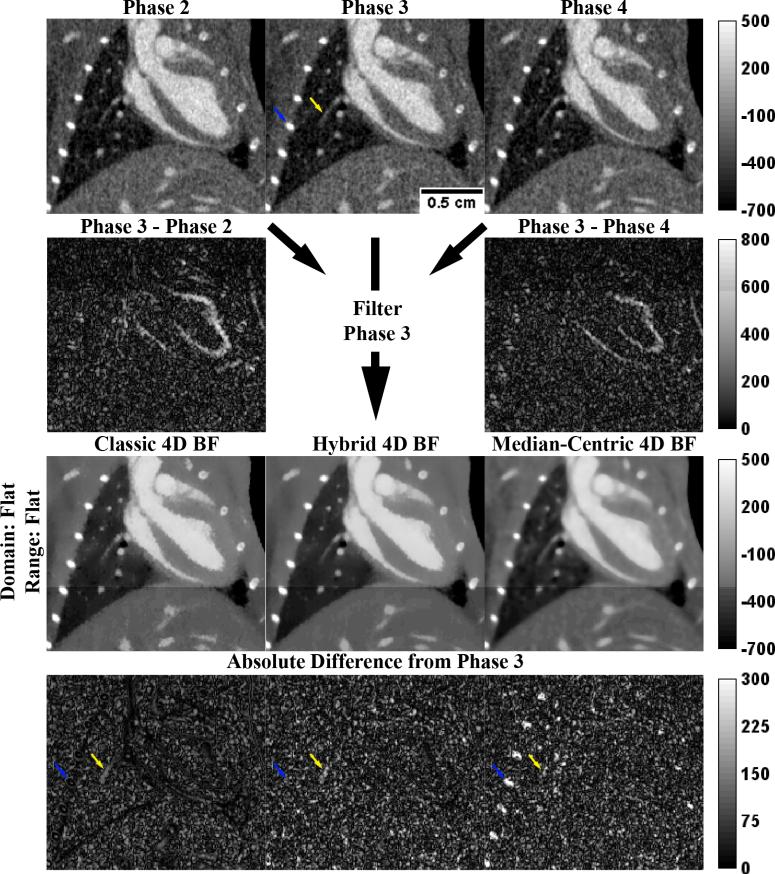
Figure 5. Application of the Optimal 4D Bilateral Filters to In Vivo Data.
Application of the optimal 4D BFs (Table 2, highlighted in yellow) to a slice of the in vivo data (“Phase 3”). For 4D BF, the filtering kernel expands to the phases before and after (phases 2 and 4, respectively) the phase being filtered (phase 3). Anatomic labels have been excluded for clarity (see Figure 3). Blue and yellow arrows denote a point of interest referenced in the text. The scale bar on “Phase 3” applies to all images. Intensity calibration bars apply to all images in their respective rows. All intensities are reported in HU.

