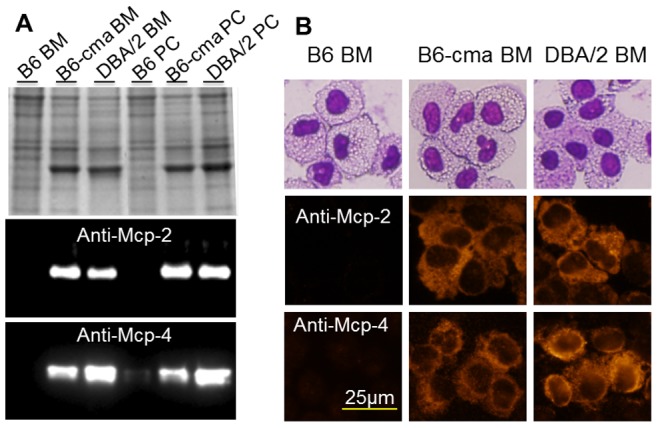
Figure 4. Comparison of Mcp-2 and Mcp-4 protein levels in mast cells from B6, B6-cma, and DBA/2 mice.

Mast cells were derived from bone marrow (BM) and peritoneal cavity (PC) of B6, B6-cma, and DBA/2 mice. A. Cell extracts were resolved on 12.5% SDS gels followed by Coomassie blue staining (top panel) or western blotting with indicated antibodies. B. Cells were subjected to Wright-Giemsa staining (top panel) or immunofluorescent staining with indicated antibodies.
