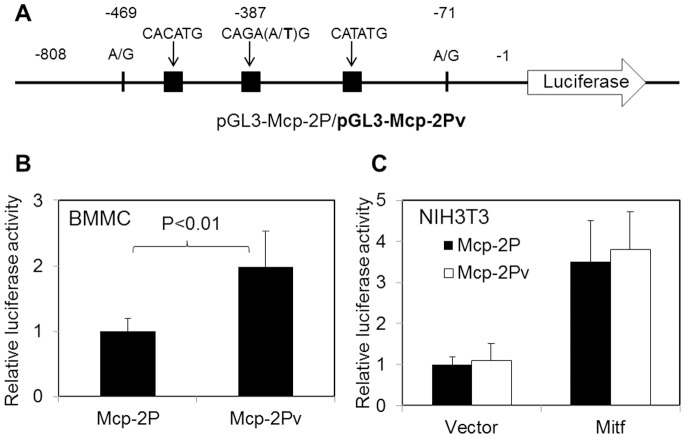
Figure 7. Reporter gene assays.
A. Schematic diagram of report gene constructs. SNPs are indicated, and black blocks represent CANNTG motifs (E-boxes). B. Report gene constructs were transfected into mast cells derived from bone marrow of B6 mice. C. Report gene constructs together with pcDNA3 plain vector or pcDNA3-Mitf-A were transfected into NIH3T3 cells. Relative report gene expression is represented by firefly luciferase activity normalized against that of renilla luciferase. Error bars denote standard deviation (n≥3).

