
Figure 4.
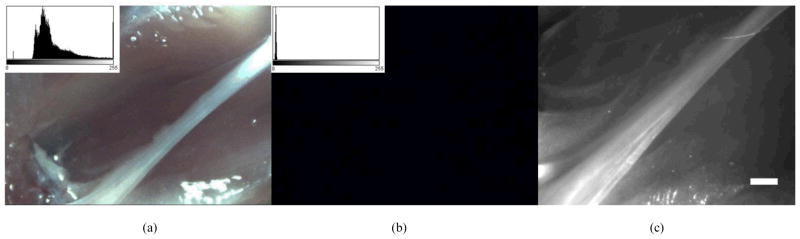
Results of control experiment. (a) White light image of control sciatic nerve (b) fluorescence image of control sciatic nerve. The image histogram is displayed in the upper left corner of 4a and 4b, showing no signal in the fluorescence channel. (c) Zeiss Lumar microscope image of the same image showing the size of the nerve. Scale bar is 1mm.