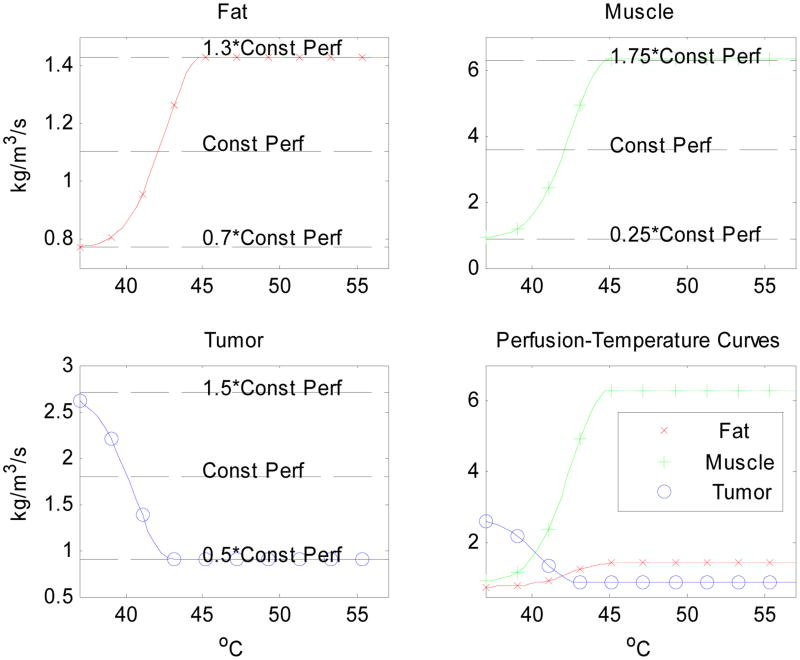
Figure 2.
Curves modeling perfusion-temperature relations in fat, muscle and tumor, attempting to mimic the trend observed in Song's experimental data. Here we assume a decreasing tumor perfusion with temperature. In developing these functions, we assumed that perfusion increases with temperature in fat and muscle, ranging from 30% below to 30% above the constant perfusion value of fat, plus and minus 75% for muscle in Table 1. However, a decreasing perfusion was assumed for tumor, ranging from 50% below to 50% above the constant perfusion value in Table 1.

