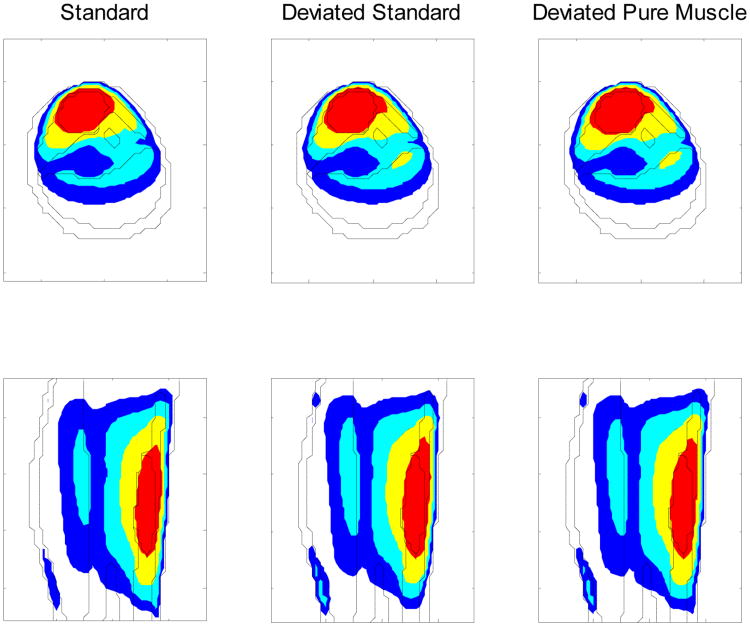
Figure 3.
Temperature distributions in axial and sagittal views of lower leg sarcoma patient at the 49th iteration, for an initial driving vector corresponding to the minimum eigenvector of the approximate model, with piecewise constant perfusion, constructed by the reduced subspaces spanned by the first 4 virtual source basis vectors of different models (labeled above) with (linear) constant perfusion. The temperatures were determined from bio-heat transfer equations with nonlinear temperature-dependent perfusion (tumor perfusion rapidly decreases with temperature.) The outermost ring is fat, within which is the muscle region. The larger irregular object on the topside of the muscle region is tumor, and the two smaller irregular objects at the center are bone. The colored regions are: red for ≥ 43°C, yellow for ≥ 41°C, light blue for ≥ 40°C and blue for ≥ 39°C.

