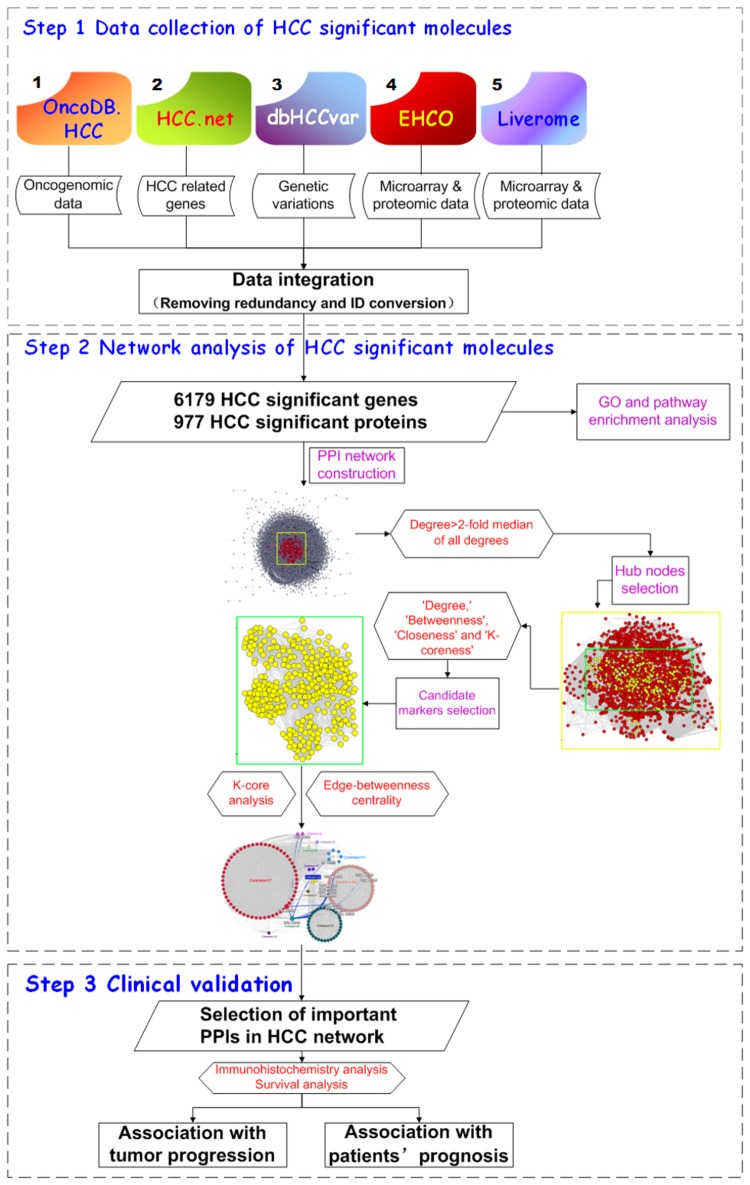
Figure 1. A schematic diagram of this systems biology-based analysis for HCC marker identification.
First, HCC significant molecules which were differentially expressed or had genetic variations in HCC tissues relative to their corresponding normal tissues were collected from five existing HCC related databases (OncoDB.HCC, HCC.net, dbHCCvar, EHCO and Liverome). Second, their protein-protein interaction networks were constructed and the hub proteins were chosen according to node degree. Third, a list of candidate HCC markers were identified by calculating four topological features of the network ('Degree', 'Betweenness', ‘Closeness’ and 'K-coreness' ). After that, the key PPIs of candidate HCC markers were selected by K-core analysis and edge-betweenness algorithm. The K-core of a graph is defined as the largest subgraph where every node has at least k links. For each choice of k, we determine the k-cores by iteratively pruning all nodes with degree lower than k and their incident links. The edge-betweenness algorithm is a top-down, divisive method for grouping network components into modules. Edge-betweenness centrality is the frequency of an edge that places on the shortest paths between all pairs of vertices. The edges with highest betweenness values are most likely to lie between sub-graphs. Here, we chose PPI (between RL30_HUMAN and GRB2_HUMAN) with highest edge-betweenness as the most important PPI in HCC network because it may connect different cores with the shortest paths. Finally, the clinical significance of RL30_HUMAN (RPL30) and GRB2_HUMAN (GRB2) was validated using a large cohort of patients with HCC.

