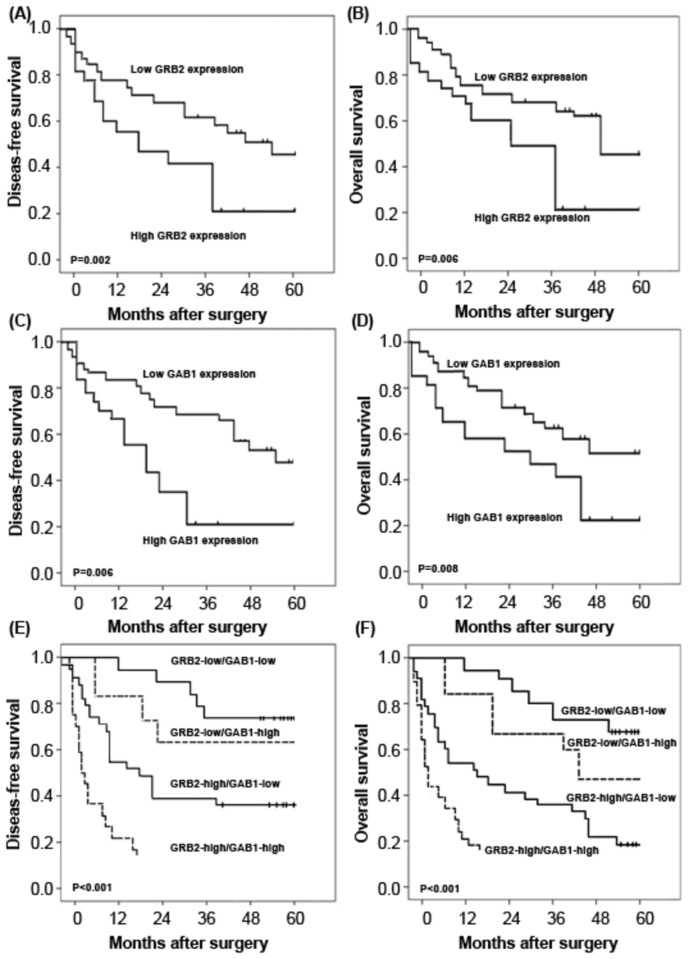
Figure 6. Disease-free survival and overall survival curves for two groups defined by low and high expression of GRB2 (A and B) and GAB1 (C and D), and for four groups defined by combined expression of GRB2 and GAB1 (E and F), in patients with HCC.
The patients with high GRB2 and GAB1 expression had a significantly shorter 5-year overall and disease-free survival rate than those with low GRB2 and GAB1 expression (both P=0.008). In addition, the results by pairwise comparisons showed that the statistically significant difference of overall and disease-free survival existed between GRB2-high/GAB1-high patients and any of other three groups (both P<0.001). In all four groups, GRB2-high/GAB1-high patients had the poorest prognosis.

