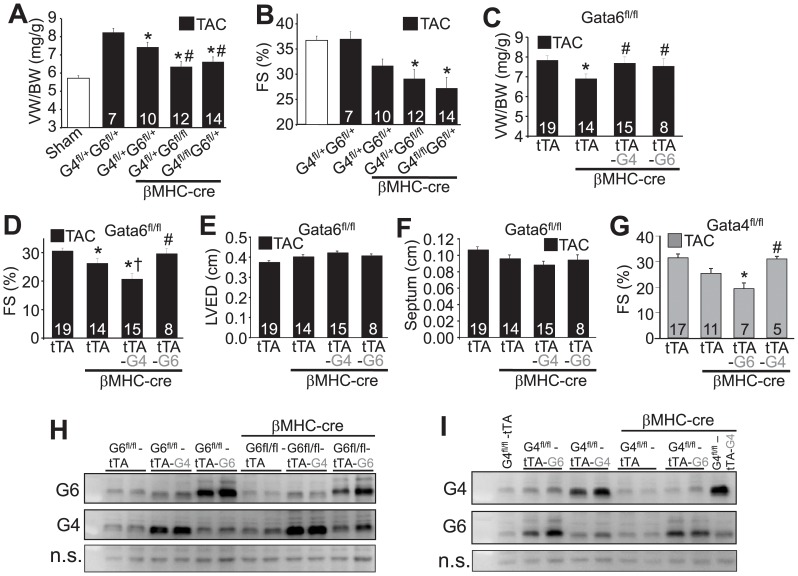
Figure 2. GATA-4 and GATA-6 play redundant roles in programming cardiac hypertrophy but not in adapting functional compensation.
A, Ventricular weight to body weight (VW/BW) in the indicated genotypes of mice at 10–12 weeks of age following 2 weeks of TAC stimulation. The number of mice analyzed is shown in each bar of the graph. *P<0.05 versus Gata4fl/+ Gata6fl/+; #P<0.05 versus Gata4fl/+ Gata6fl/+ with the βMHC-cre transgene. B, Fractional shortening (FS%) from the indicated mice at 10–12 weeks of age following sham or 2 weeks of TAC stimulation. The number of mice analyzed is shown in each bar of the graph. *P<0.05 versus Gata4fl/+ Gata6fl/+ with the βMHC-cre transgene. C, VW/BW in the indicated groups of mice after 2 weeks of TAC stimulation at 10–12 weeks of age. The number of mice analyzed is shown in each bar of the graph. *P<0.05 versus Gata6fl/fl tTA transgene; #P<0.05 versus Gata6fl/fl-βMHC-cre tTA transgene. Abbreviations; tTA-G4, tetracycline transactivator transgene with the GATA-4 (G4) transgene; tTA-G6, tetracycline transactivator transgene with the GATA-6 (G6) transgene. D, Fractional shortening to measure ventricular performance of the same mice described in “C”. *P<0.05 versus Gata6fl/fl tTA transgene; †P<0.05 versus Gata6fl/fl-βMHC-cre tTA transgene; #P<0.05 versus Gata6fl/fl-βMHC-cre tTA transgene or Gata6fl/fl-βMHC-cre tTA transgene with GATA-4 transgene. E, F, Echocardiography measured left ventricular end diastolic dimension (LVED) and septal thickness in hearts of the indicated groups of mice after 2 weeks of TAC. G, Fractional shortening in Gata4 heart-specific, deleted mice with the additional transgenes shown after 2 weeks of TAC stimulation. Number of mice analyzed is shown in the bars. *P<0.05 versus Gata4fl/fl tTA transgene; #P<0.05 versus Gata4fl/fl-βMHC-cre tTA transgene with the GATA-6 transgene. H, I, Western blot analysis for GATA-4 (G4) or GATA-6 (G6) protein from the hearts of the indicated mice. A non-specific (n.s.) band from each of the western blots was used to show equal loading and running conditions.

