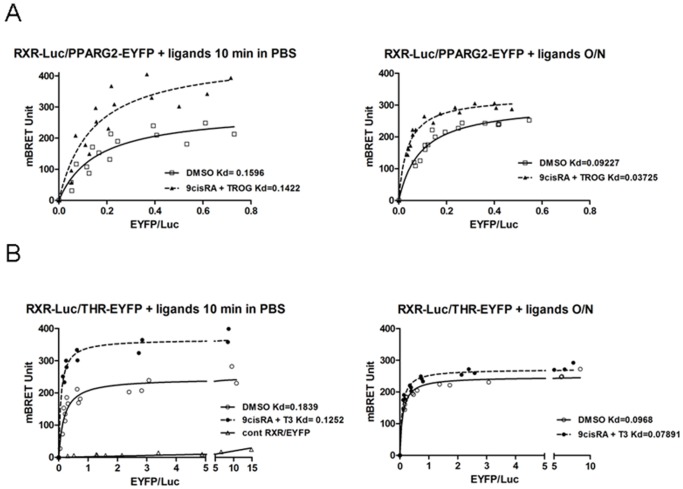
Figure 3. Titration BRET experiments in living cells.
BRET between RXR-Luc and PPARG2-EYFP, RXR-Luc and THR-EYFP. Regression curves are represented with the BRET value as a function of the fluorescence/luminescence ratio (EYFP/Luc). HEK293T cells were transfected with a fixed amount of RXR-Luc donor plasmid together with increasing amount of acceptor plasmids (PPARG2-EYFP above or THR-EYFP and EYFP lower) and BRET was measured in living cells after stimulation with control DMSO or ligands either on resuspended cells 5–10 minutes in PBS (left panel), or on adherent cells during an overnight (O/N) incubation in culture medium (right panel). Values represent BRET measures (each in triplicate) integrated over a 20 min reading (A), BRET titration curves between RXR-Luc and PPARG2-EYFP from control cells (open square) and from cells stimulated 5 min with ligands 9cis RA+TROG (filled triangle) in PBS resuspended cells (left panel) or from adherent cells stimulated O/N (right panel) (B), BRET titration curves between RXR-Luc and THR-EYFP from control cells (open circles) and from cells stimulated 5 min with 9cisRA+T3 (filled circles) in PBS (left panel) or from adherent cells stimulated O/N (right panel) (right panel). A negative control saturation experiment is also shown between a RXR-Luc donor and an unfused EYFP acceptor protein (open triangle). Apparent affinity (apparent Kd) between RXR-Luc and PPARG2-EYFP or RXR-Luc and THR-EYFP represents EYFP/Luc ratio corresponding to the BRETmax/2 value (BRET50). Shown are cumulative data from three independent experiments in triplicate.

