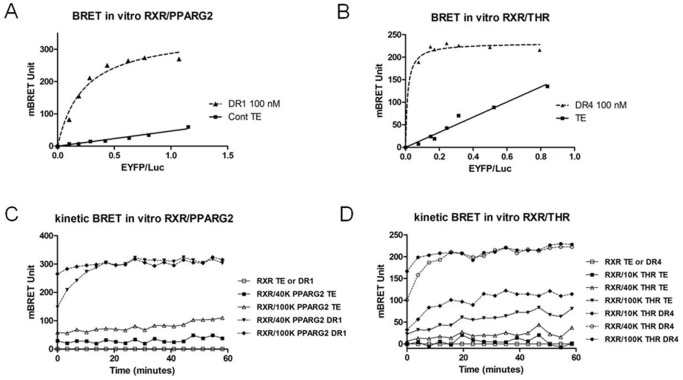
Figure 4. In vitro BRET shift between NRs in cleared cell lysates in the presence of a DNA RE.
(A and B) For these in vitro titration BRET experiments, a fixed amount of PLB cell lysate expressing RXR-Luc protein (80 ku luciferase) is mixed with increasing amount of a PLB cell lysate expressing PPARG2-EYFP or THR-EYFP (0, 10, 20, 30, 50, 75, 100 or 150 ku of fluorescence) and regression curves are represented as the BRET value (recorded over a 20 min period) as a function of the fluorescence/luminescence ratio in the absence (control TE: Tris 10 mM PH 7,5; EDTA 1 mM) or presence of 100 nM of dsDNA RE (diluted in TE). (A) In vitro BRET saturation between RXR-Luc and PPARG2-EYFP with TE (control TE, filled squares) or 100 nM of dsDNA DR1 (filled triangles). (B) In vitro BRET saturation between RXR-Luc and THR-EYFP with TE (control TE, filled squares) or 100 nM of dsDNA DR4 (filled triangles). (C) One hour BRET kinetic monitoring in vitro interaction between 80 ku of donor RXR-Luc and 40 ku or 100 ku fluorescence of PPARG2-EYFP in the absence (control TE) or presence of 100 nM of dsDNA RE DR1. (D) One hour BRET kinetic monitoring in vitro interaction between 80 ku of donor RXR-Luc and 10 ku, 40 ku or 100 ku fluo of THR-EYFP in the absence (control TE) or presence of 100 nM of dsDNA RE DR4.

