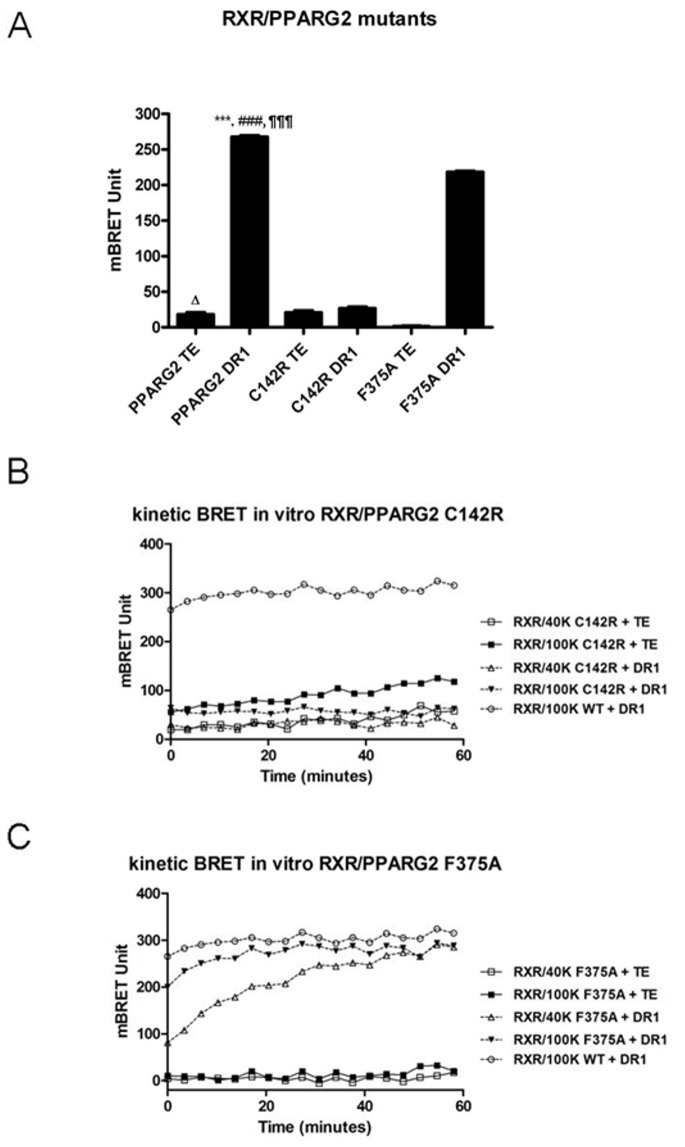
Figure 6. Analysis of DNA binding mutants.
(A), BRET shift between 80 ku of RXR-Luc and 40 ku of PPARG2-EYFP-WT or mutants PPARG2-EYFP-C142R and PPARG2-EYFP-F375A in presence or absence of 100 nM DR1 dsDNA RE. Values represent BRET measures (each in triplicate) integrated over a 10 min reading. Values shown are means ± SD of three independent experiments (n = 3). Statistical differences of PPARG2WT DR1 relative to TE control (***P<0.001), PPARG2-C142R DR1 (###P<0.001) and PPARG2-F375A DR1 (¶¶¶P<0.001), as well as PPARG2WT TE control relative to PPARG2-F375A TE (ΔP<0.05) were analyzed by one-way ANOVA followed by Dunnett’s multiple comparison post hoc test. (B), One hour BRET kinetic monitoring interaction between 80 ku of donor RXR-Luc and 40 ku or 100 ku fluo of PPARG2-EYFPC142R in the absence (control TE) or presence of 100 nM of dsDNA RE DR1. (C), One hour BRET kinetic monitoring interaction between 80 ku of donor RXR-Luc and 40 ku or 100 ku fluo of PPARG2-EYFPF375A in the absence (TE) or presence of 100 nM of dsDNA RE DR1. For comparison with PPARG2WT in graphs 6B and 6C, a BRET kinetic recording interaction between 80 ku of donor RXR-Luc and 100 ku fluo of PPARG2-EYFPWT in the presence of 100 nM of dsDNA RE DR1 is shown (open circle).

