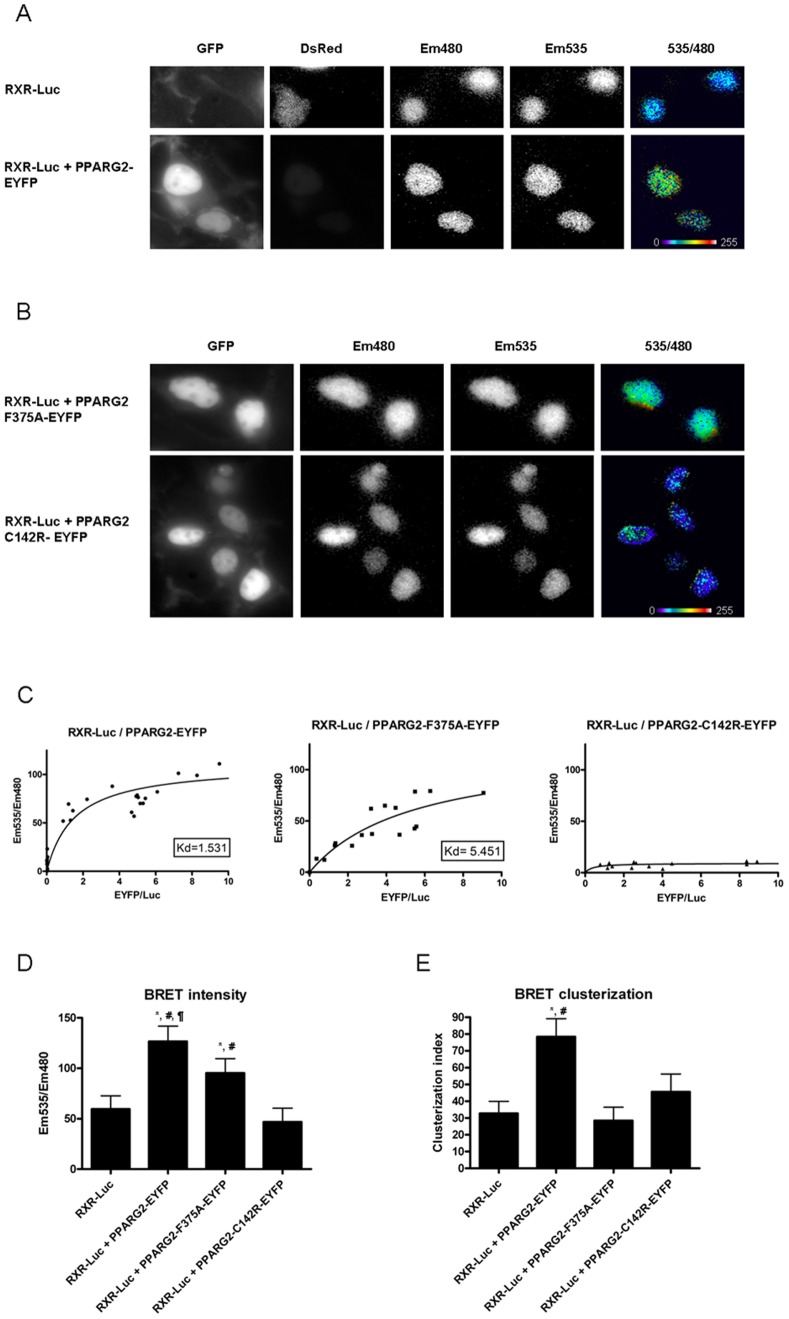
Figure 9. Subcellular localization of the interaction between RXR and PPARG2.
BRET imaging was recorded in (A), HEK293T cells co-transfected with RXR-Luc and DsRed (as a transfection reporter) or RXR-Luc and PPARG2-EYFP or (B), HEK293T cells co-transfected with RXR-Luc and PPARG2-EYFP-F375A or PPARG2-EYFP-C142R. The pictures show expression of PPARG2-EYFP or mutants (GFP), RXR-Luc (Em480), PPARG2-EYFP or mutants excited by energy transfer (Em535) and BRET signal generated by the two tagged proteins (535/480). Please note the high and clustered BRET signals obtained between RXR-Luc and PPARG2-EYFP. The pixel-by-pixel 535 nm/480 nm ratios were calculated by dividing the absolute light intensities per pixel of images obtained at 535 nm over 480 nm. These numerical ratios (comprised between 0 and 1.5) were translated and visualized with a continuous 256 pseudo-color look-up table (LUT) as displayed in the figures (C) Titration curves were obtained by expressing for each cell the mean BRET intensity (Em535/Em480) as a function of the mean fluorescence/luminescence ratio (EYFP/Luc). Histograms represent the mean BRET intensity (D) and standard deviation (clusterization index) (E). A high standard deviation indicates a clusterization of the signal. Statistical differences were analyzed by one-way ANOVA followed by Bonferroni post hoc test: *P<0.05 (significant against RXR-Luc); #P<0.05 (significant against PPARG2-EYFP-F375A); ¶P<0.05 (significant against PPARG2-EYFP-C142R). The number of cells assayed for each condition was the following: 11 cells for RXR-Luc alone (control); 23 cells for RXR-Luc and PPARG2-EYFP; 15 cells for RXR-Luc and PPARG2-EYFP-F375A; and 21 cells for RXR-Luc and PPARG2-EYFP-C142R.

