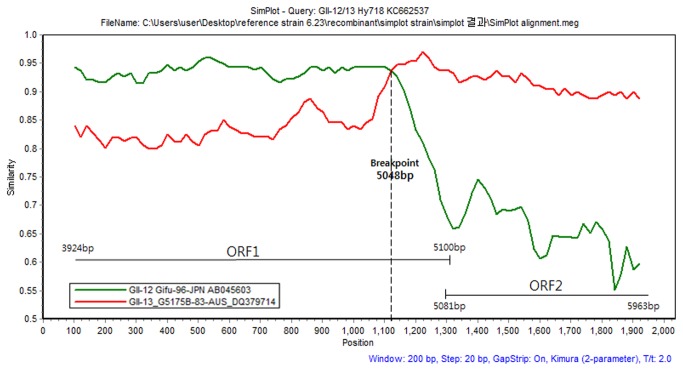
Figure 6. SimPlot analysis was performed using a window size of 200 nucleotides and a 20 nucleotide step.
The Hy718-KOR (KC662537) strain was compared with Gifu-96-JPN (green line) and G5175B-83-AUS (red line) using a, partial sequence (2034 bp) of ORF1 and ORF2 regions. The vertical axis indicates the similarity (%) of nucleotide sequence between the query strain and other reference strains. The horizontal axis indicates the positions of nucleotides.

