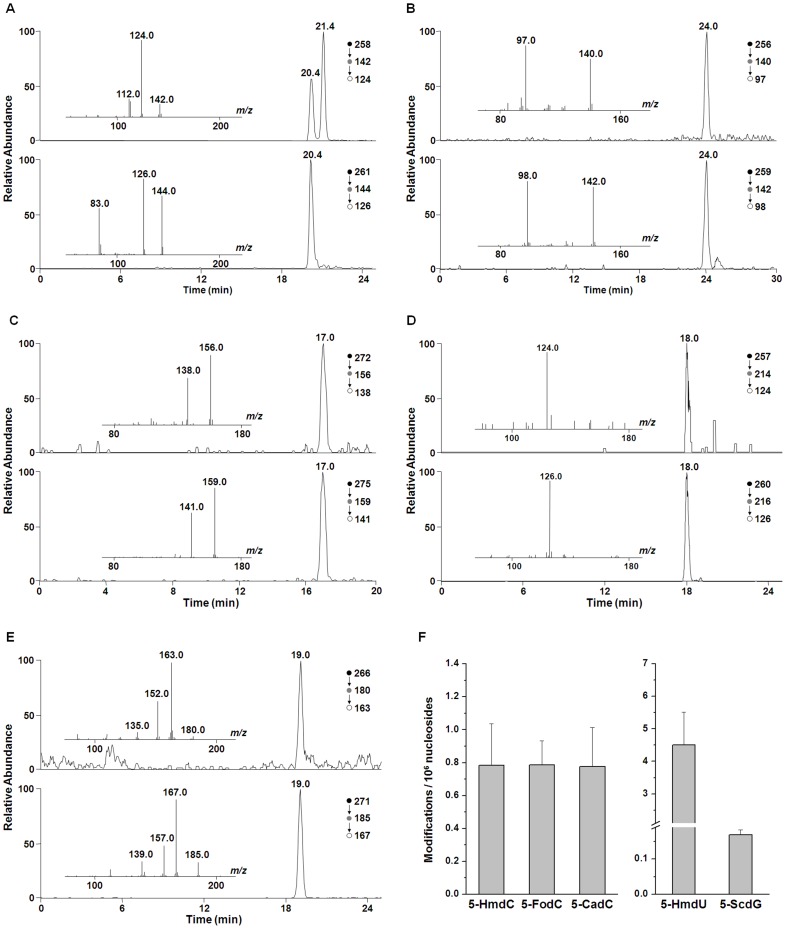
Figure 3. Representative LC-MS/MS/MS results for the quantification of 5-HmdC (A), 5-FodC (B), 5-CadC (C), 5-HmdU (D), S-cdG (E), and quantification results (F) in Arabidopsis DNA.
Shown in panels A-E are the selected-ion chromatograms for monitoring the indicated transitions for the analytes (top trace) and the isotope-labeled standards (bottom trace), and the insets give the MS/MS/MS results for the analytes and internal standards.

