
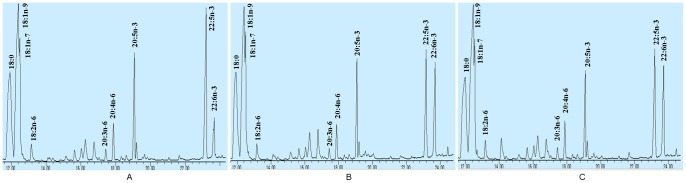
Figure 3. Partial gas chromatograph traces showing fatty acid profiles of total cellular lipids extracted from the control cells infected with EGFP (A), the cells infected with sEgD4 (B) and the cells infected with sScD4 (C).
Official websites use .gov
A
.gov website belongs to an official
government organization in the United States.
Secure .gov websites use HTTPS
A lock (
) or https:// means you've safely
connected to the .gov website. Share sensitive
information only on official, secure websites.