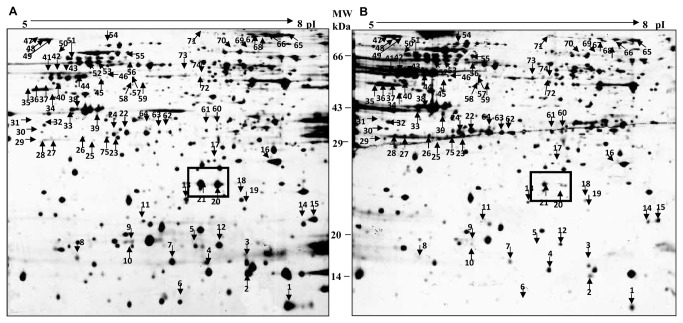
Figure 3. 2-DE gel images of proteins extracted from AML14.3D10 cells.
Proteins were extracted from AML14.3D10 cells A. untreated and B. treated with rhSP-D (10µg/ml) for 48h. Proteins (400µg) were separated by iso-electric focusing on IPG strips, 17cm, pI range 5-8 and SDS-PAGE on 12% Laemmli gels (n=3). Differentially expressed proteins (PDQuest Image Analysis Software version 7.2) showing a change of ≥ 3 were identified by MALDI-TOF-MS and MALDI-TOF-MS-MS (75 proteins, marked with arrows) (Table S1). The proteins marked in box are identified as HMGA1 proteins, which were downregulated on rhSP-D treatment.

