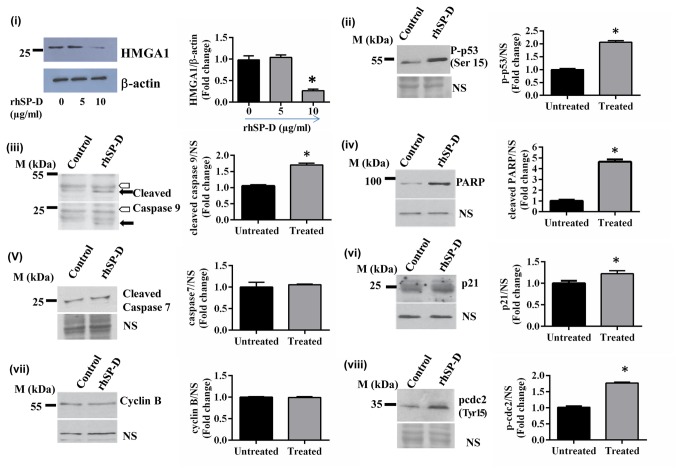
Figure 5. rhSP-D treatment results in downregulation of HMGA1 levels and activates p53 and the apoptotic pathway.
(i) AML14.3D10 cells treated with rhSP-D (5 and 10µg/ml) for 48h, were analyzed for HMGA1 expression by western blot. The cells incubated with rhSP-D (10µg/ml) for 24h were also analyzed for the levels of (ii) phospho-p53 (Ser15), (iii) cleaved caspase 9, (iv) cleaved PARP, (v) cleaved caspase 7, (vi) p21, (vii) cyclin B and (viii) phospho-cdc2 by immunoblotting. NS points to a non-specific band that displays equal protein loading in different lanes. Cleavage of caspase 9 (iii) produces two bands of molecular mass 37 kDa (upper panel; black arrow) and 17 kDa (lower panel; black arrow). Hollow arrow points to a non-specific band that displays equal protein loading. On the right is shown the quantification of the normalized values, *p<0.05, n=3 independent experiments.

