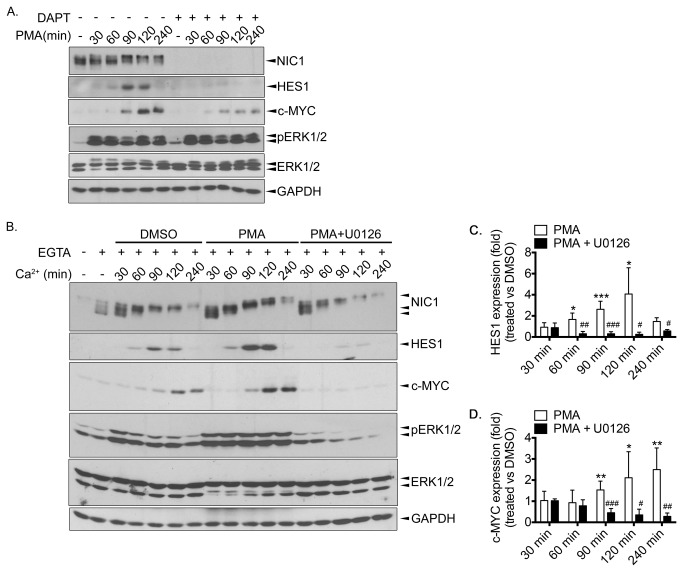
Figure 4. Activation of the MEK/ERK pathway promotes NOTCH signalling.
A. MIA PaCa-2 cells were pre-treated (+) or not (-) with DAPT (25μM) overnight. Cells were then treated with PMA (100nM) for the indicated time periods. B. MIA PaCa-2 cells were left untreated (-) or treated with EGTA (4mM) for 15min (+). EGTA-containing medium was removed and replaced by normal culture media (Ca2+) containing DMSO, PMA (100nM) or PMA + U0126 (10μM) for the indicated time periods. A. and B. Cells were lysed and Western blot analyses were performed using the indicated antibodies. C. From similar experiments presented in B., a graphic representation depicting relative HES1 expression, for each time period, in treated cells (PMA, PMA+U0126) compared to control cells (DMSO-treated) is shown. D. From similar experiments presented in B., a graphic representation depicting relative c-MYC expression, for each time period, in treated cells (PMA, PMA+U0126) compared to control cells (DMSO-treated) is shown. C. and D. The results are the means ± SEM of at least three independent experiments. * p<0.05, ** p<0.005, ***p<0.0005 compared to the corresponding time period in DMSO-treated cells. # p<0.05, ## p<0.005, ### p<0.0005 compared to the corresponding time period in PMA-treated cells.

