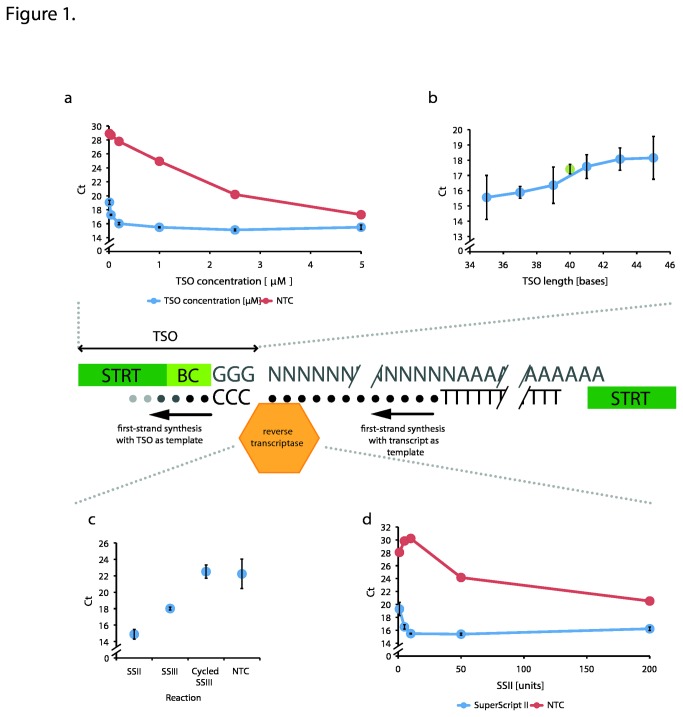
Figure 1. | Optimal conditions for template switching.
The qPCR-derived Ct values for the investigated conditions are shown. Please note that the y-axis scales are broken and that the graphs have different Ct value scales. Also, no error bars are shown for the no template controls (NTC) as these reactions were performed in only one tube. In contrast, the actual experiments were performed in triplicate with the standard deviation error bars displayed in the graphs. The central part of the figure illustrates the template-switching process in the setting of our STRT method. (a) The optimal TSO concentration was 1 μM and (b) shorter TSOs showed a tendency for better performance (see also Table S2 and Figure S1 in File S1). The green datapoint in the TSO length graph represents the published version of the TSO [10] that is 40 bases in length. (c) shows analysis of different RT enzymes. SSII was a better choice than SSIII and, a cycled SSIII protocol (8 cycles of 50°C for 5 min and 60°C for 1 min; [19]) did not work, possibly due to the elevated temperature periods inactivating the enzyme (see also Table S2 in File S1). (b) The optimal SSII amount was 10 units per 10 μl reaction.

