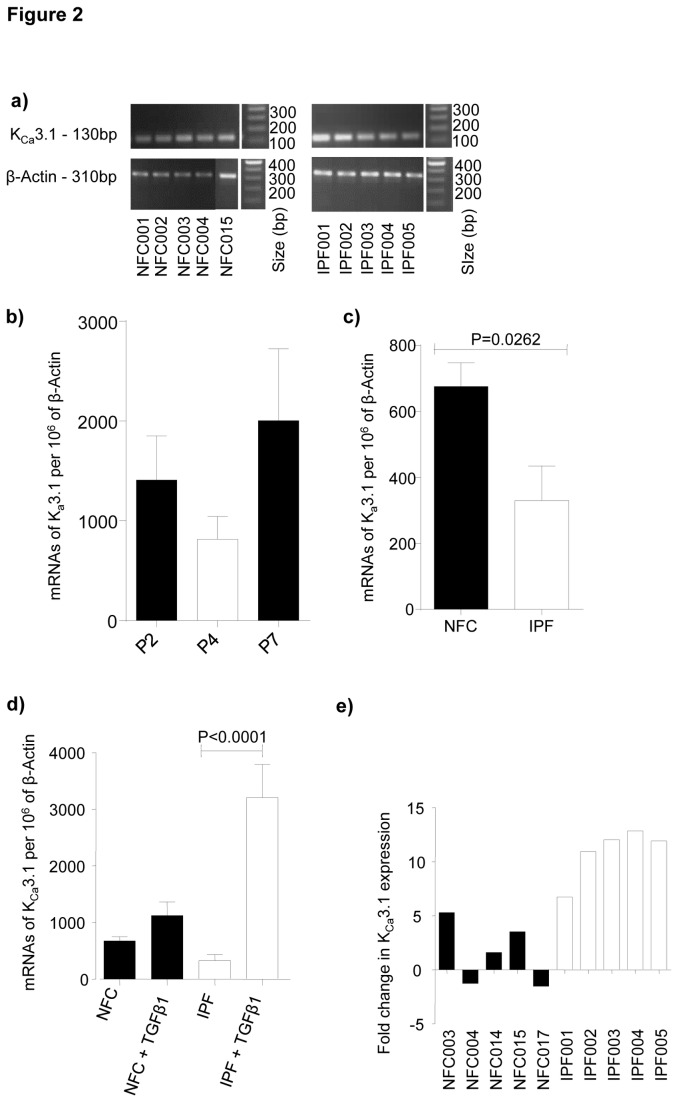
Figure 2. KCa3.1 channel mRNA is expressed by myofibroblasts and upregulated following TGFβ1 stimulation.
a) Products from quantitative real-time PCR for KCa3.1 were visualized on a 1.5% agarose gel to confirm that only one product was amplified and that it was the correct size (130 bp). β-Actin was used as the normalizing control (310bp). b) In preliminary experiments we examined the mRNA expression levels of KCa3.1 in the NFC donors at passages 2, 4 and 7 and again found no significant differences. To be sure that passage number had no effect all experiments were performed between passages 4 and 5. Data represent mean±SEM. c) Quantitative real-time PCR showed that KCa3.1 mRNA expression was greater in NFC donors (n=5) than IPF donors (n=5), P=0.0262 (unpaired t test). d) KCa3.1 mRNA expression increased after TGFβ1 stimulation (All groups; 1-way ANOVA, P<0.0001), NFC donors (n=5), IPF donors (n=5). There was a highly significant increase in IPF myofibroblasts following 24h of TGFβ1 stimulation. P<0.0001 (corrected by Bonferroni's multiple comparison test). e) Quantitative real-time PCR demonstrating the relative fold increase in NFC and IPF myofibroblasts after stimulation with TGFβ1. Following normalization with β-actin there was a relative fold increase in KCa3.1 expression in all IPF donors. Results were calculated using the δδCT method. Data represented as ±SEM for Figure 1b,c and d.

