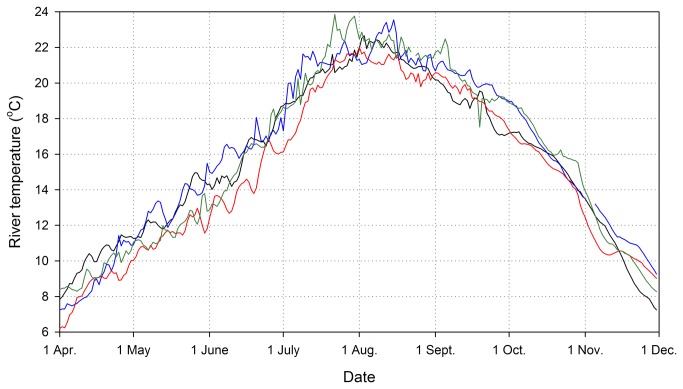
Figure 2. Mean daily water temperatures recorded at Ice Harbor Dam in 2000-2003.
Temperatures were monitored by the U.S. Army Corps of Engineers in the dam forebay at a depth of 5 m; similar data were collected at Lower Monumental, Little Goose, and Lower Granite dams. Black line = 2000, blue line = 2001, red line = 2002, green line = 2003.

