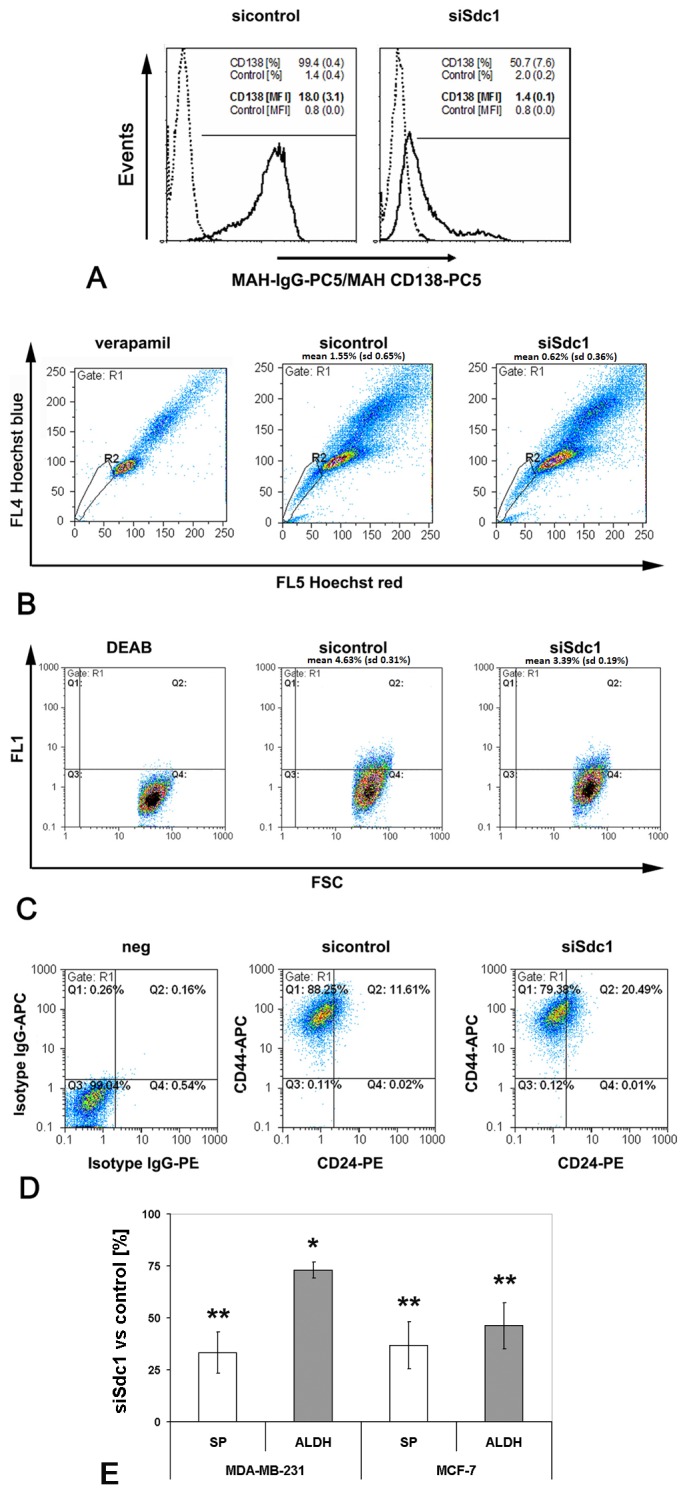
Figure 1. Flow cytometric analysis of putative cancer stem cell pools in control and Syndecan-1-silenced MDA-MB-231 breast cancer cells.

Syndecan-1 silencing reduces the SP phenotype, ALDH1 activity, and the CD44(+)/CD24(-/low) phenotype. A) Confirmation of Syndecan-1 siRNA knockdown by flow cytometry. The percentage of marker-positive cells and the mean fluorescent intensity of events (mean (SD), n=4) are depicted on the plots. (Dotted lines: mouse-IgG1-PC5 control; solid lines: anti-CD138-PC5; marker for percentage of CD138-positive cells; MFI = median fluorescent intensity). B) Side population analysis. Control and Syndecan-1-depleted cells were incubated with the Hoechst 33342 dye in the presence or absence of 50 µM verapamil, and subjected to flow cytometry. Gate R1 shows SP cells. C) Example of the identification of putative cancer stem cells displaying aldehyde dehydrogenase (ALDH) activity. Control and Syndecan-1 knockdown cells were incubated with fluorescent ALDH substrate in the presence or absence of the inhibitor diethylaminobenzaldehyde (DEAB), followed by flow cytometric analysis. D) Example of flow cytometric analysis for the cell surface expression of CD44 and CD24 protein. Control and Syndecan-1 knockdown cells were incubated with isotype IgG-PE and-APC, CD24-PE and CD44-APC antibodies followed by sorting the cells by flow cytometry into left lower quadrant CD44(-)CD24(-),left upper quadrant CD44(+)CD24(-), right lower quadrant CD44(-)CD24(+), right upper quadrant CD44(+)CD24(+). A-D) Representative examples of n≥3 experiments. E) Quantitative analysis of SP and ALDH measurements in Syndecan-1 and control siRNA treated MDA-MB-231 and MCF-7 cells. Syndecan-1 siRNA knockdown results in a significant decrease of the SP and ALDH activity. Data are expressed as mean percentage +/- SEM relative to the controls (set to 100%). (n=3-5, *=P<0.05, **=P<0.01).
