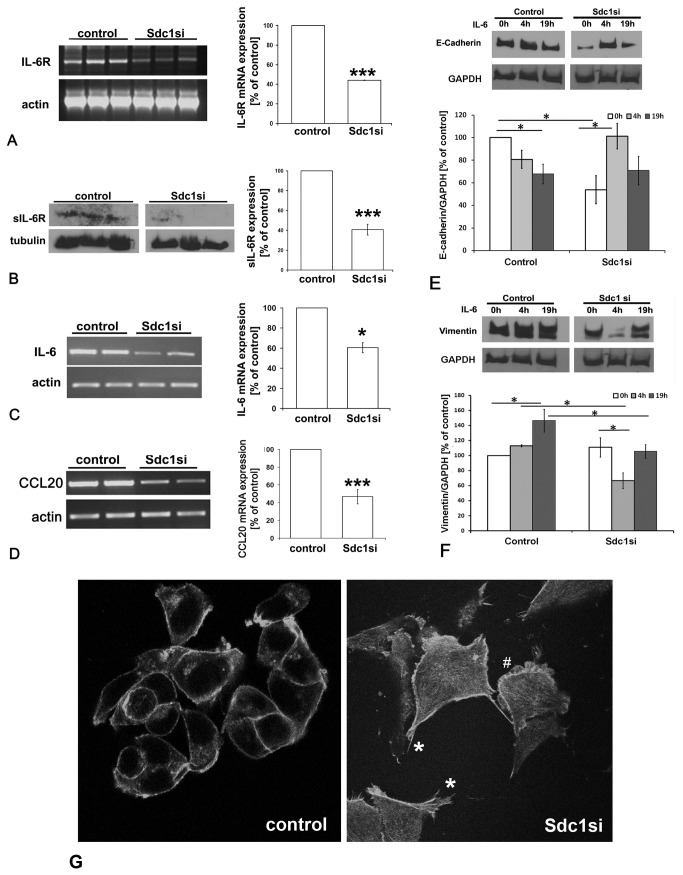
Figure 4. siRNA-mediated knockdown of Syndecan-1 downregulates expression of IL-6R, IL-6 and CCL20 and dysregulates epithelial and mesenchymal marker protein expression in MDA-MB-231 breast cancer cells.
A) left panel: RT-PCR analysis of IL-6R expression in MDA-MB-231 cells subjected to Syndecan-1 siRNA knockdown. Following total RNA isolation, mRNA was reverse transcribed and used as a template for PCR amplification of IL-6R. Right panel: PCR band intensities were normalized for actin expression and the data were analyzed using the paired Student's t-test. B) Left panel: Western blot analysis reveals reduction of IL-6R following Syndecan-1 silencing. Lysates of control and Syndecan-1 silenced cells were collected and 30-50µg protein/lane was immunoblotted and probed with sIL-6R antibody. Right panel: Immunoblot band intensities were normalized for tubulin expression and the data were analyzed using the paired Student's t-test. Data shown are triplicates from a single experiment representative of three independent experiments. C) left panel: RT-PCR analysis of IL-6 expression. Right panel: semiquantitative densitometric analysis (see panel A). D) left panel: RT-PCR analysis of CCL20 expression. Right panel: semiquantitative densitometric analysis (see panel A). *=p<0.05, ***=p<0.001, n≥3, error bars=SEM. E,F) The influence of IL-6 treatment on the expression of the epithelial marker E-cadherin (E) and the mesenchymal marker vimentin (F) was studied by Western blotting. Cells were stimulated by 50ng/ml IL-6 24h after transfection with siRNA for 4h and 19h. In control cells, IL-6 treatment for 19h promoted EMT. Syndecan-1 depletion resulted in significant downregulation of E-cadherin expression. IL-6 treatment of Syndecan-1 depleted cells for 4h resulted in marker expression changes suggestive of enhanced mesenchymal-to-epithelial transition. (E,F) Upper panels = representative Western blots, lower panels = quantitative analysis. n≥3,*=P<0.05. G) Confocal immunofluorescence microscopy of phalloidin-labeled actin filaments reveals increased formation of actin stress fibers, filopodia (*) and lamellopodia (#) in Syndecan-1 siRNA-treated compared to control siRNA treated MCF-7 cells.

