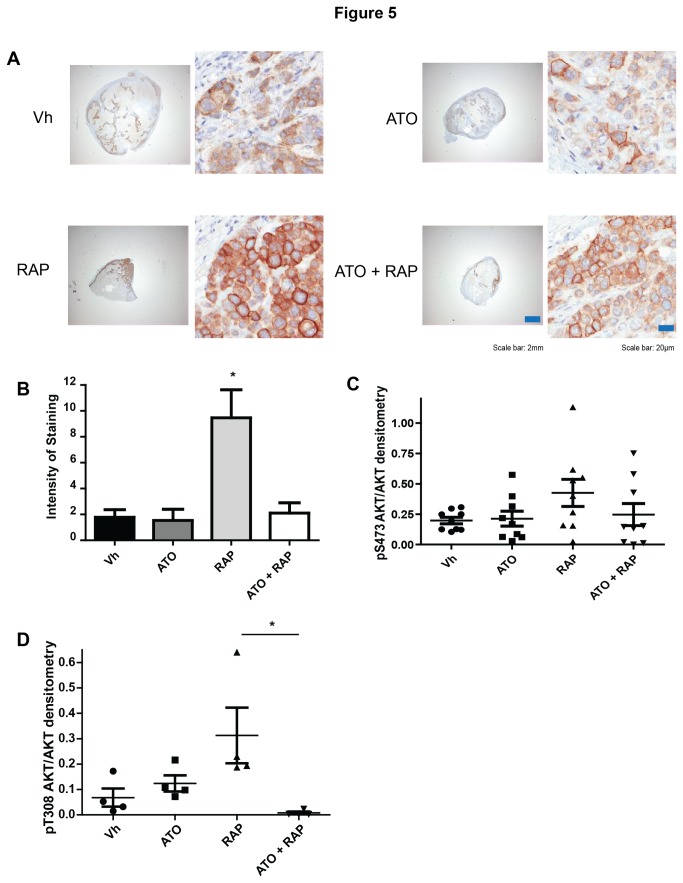
Figure 5. Addition of ATO decreases rapamycin-induced AKT activation in vivo.
Tumor samples were stained with antibody against phospho-S473-AKT. Representative pictures of each treatment are shown (A). Quantification of staining intensity was performed using algorithms provided with the ImageScope software (B). Individual animals are represented with mean and standard error bars (n=4-5 mice). (C-D) Tumors at the end of the experiment were analyzed in immunoblotting experiments with antibodies against phospho-S473-AKT (C), phospho-T308-AKT (D), AKT, and β-actin. Band densitometry was performed and the relative intensity of phospho-AKT/AKT/β-actin was calculated. Individual animals are represented with mean and standard error bars (n= 8-9 mice).

