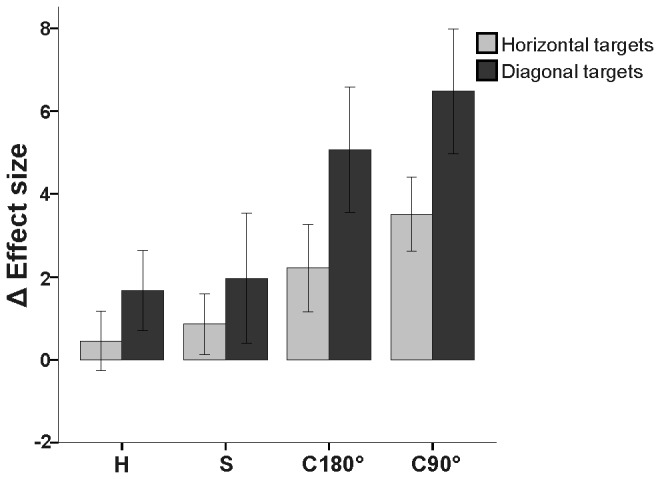
Figure 2. Effect size for decoupled conditions between IG and the control subjects.

Mean number of standard deviation units (i.e. effect size; ES) in which IG differed from control group for each dependent variable during the decoupled conditions by target type (horizontal = light gray, diagonal = dark gray). Note the increase in ES for the diagonal targets relative to the horizontal targets, and for the rotated visuomotor tasks (C180° and C90°) relative to the spatial plane dissociations ( H and S). Error bars denote 95% Confidence Intervals.
